Fig. 19
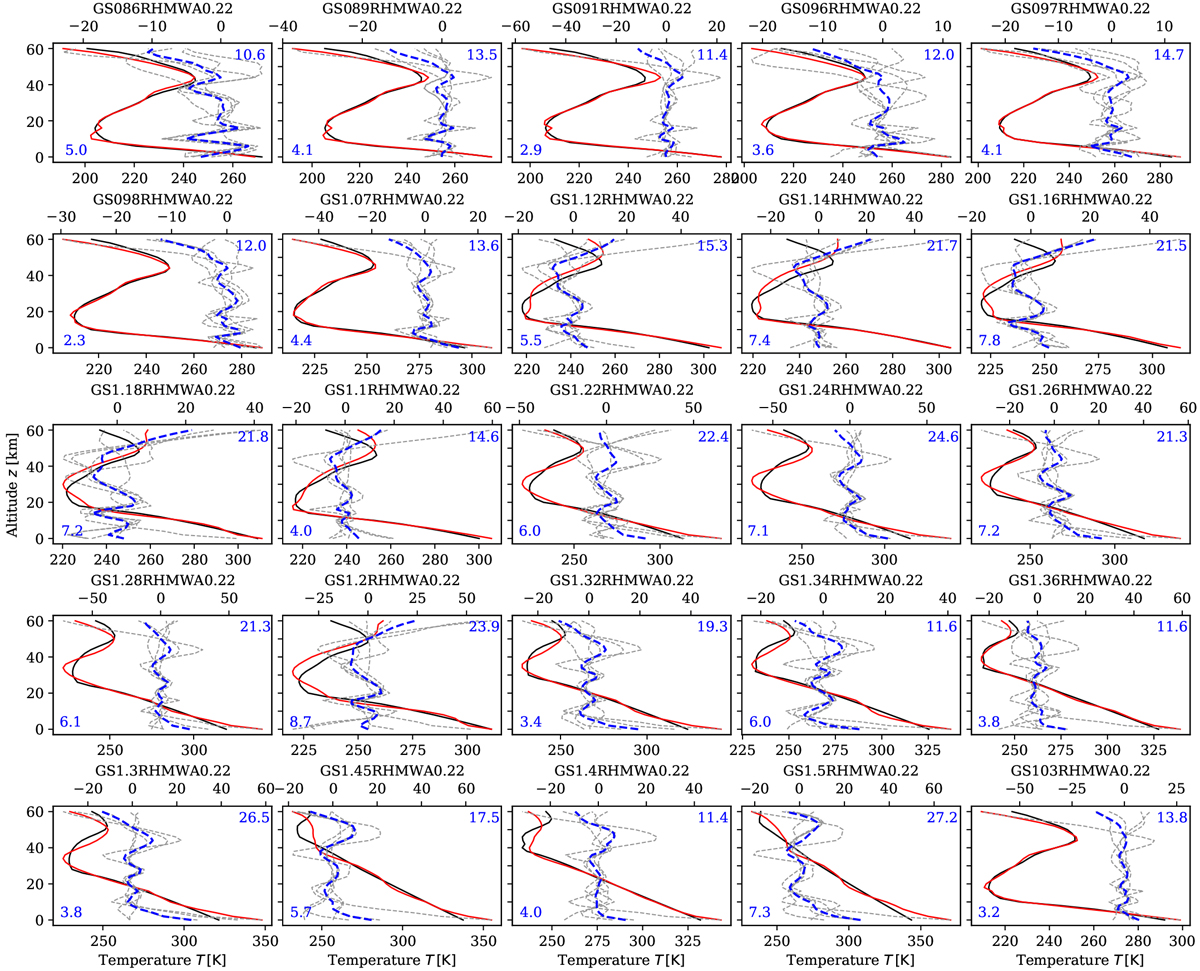
TIR-LW nonlinear least squares temperature fits of the G-star planets. Only “poor” fits with mean temperature differences (number in top right corner) larger than 10 K are shown. The number in the lower left corner is the maximum temperaturedifference in the UTLS for this mean. Line colors and styles as before. The naming convention given in the title indicates the stellar insolation, the relative humidity according to Manabe & Wetherald (1967), along with surface albedo 0.22.
Current usage metrics show cumulative count of Article Views (full-text article views including HTML views, PDF and ePub downloads, according to the available data) and Abstracts Views on Vision4Press platform.
Data correspond to usage on the plateform after 2015. The current usage metrics is available 48-96 hours after online publication and is updated daily on week days.
Initial download of the metrics may take a while.