Fig. 17
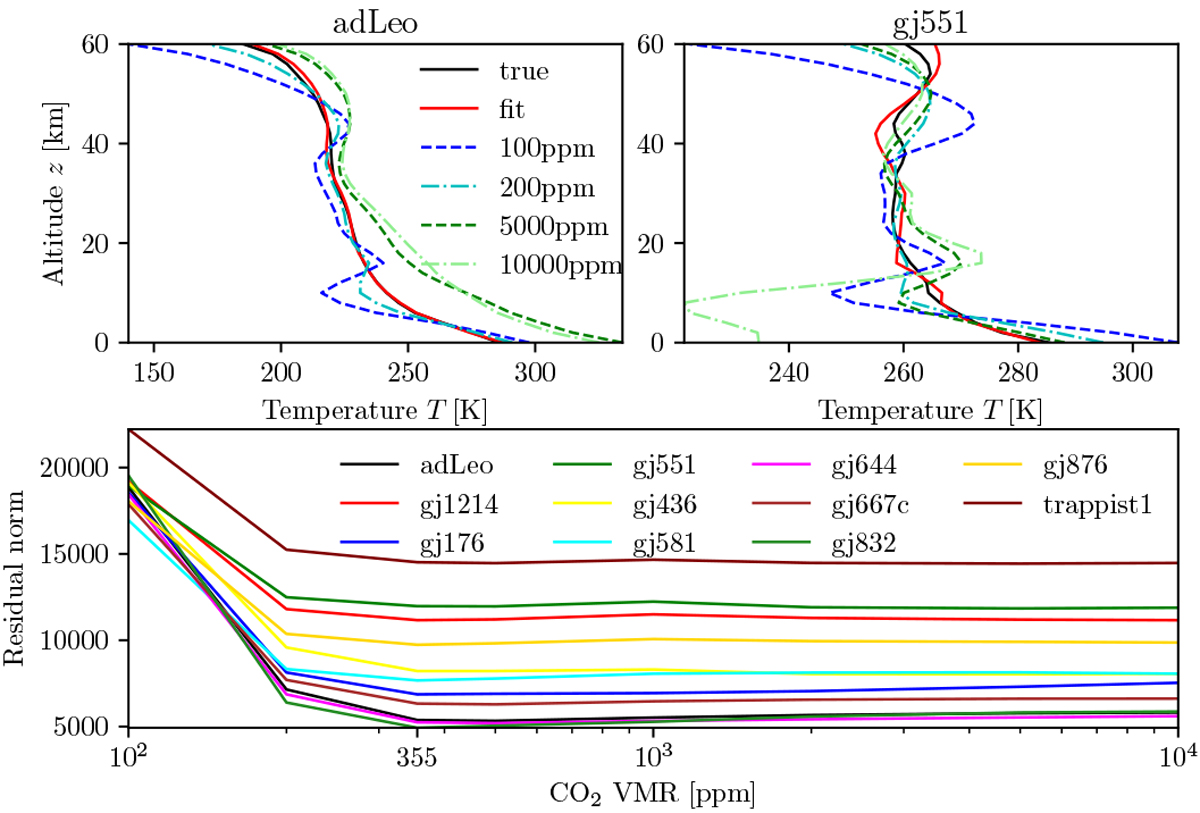
Nonlinear least squares fit of the M-Earths using the mean M-Earth atmosphere with different CO2 mixing ratios (LW TIR, S∕N = 25). Top: solid red line shows the temperature retrieved with the correct, altitude-dependent CO2 profile in the forward model. Bottom: residual norm as a function of the CO2 VMR (the value at 355 ppm corresponds to the fit with the correct CO2).
Current usage metrics show cumulative count of Article Views (full-text article views including HTML views, PDF and ePub downloads, according to the available data) and Abstracts Views on Vision4Press platform.
Data correspond to usage on the plateform after 2015. The current usage metrics is available 48-96 hours after online publication and is updated daily on week days.
Initial download of the metrics may take a while.