Free Access
Fig. 15
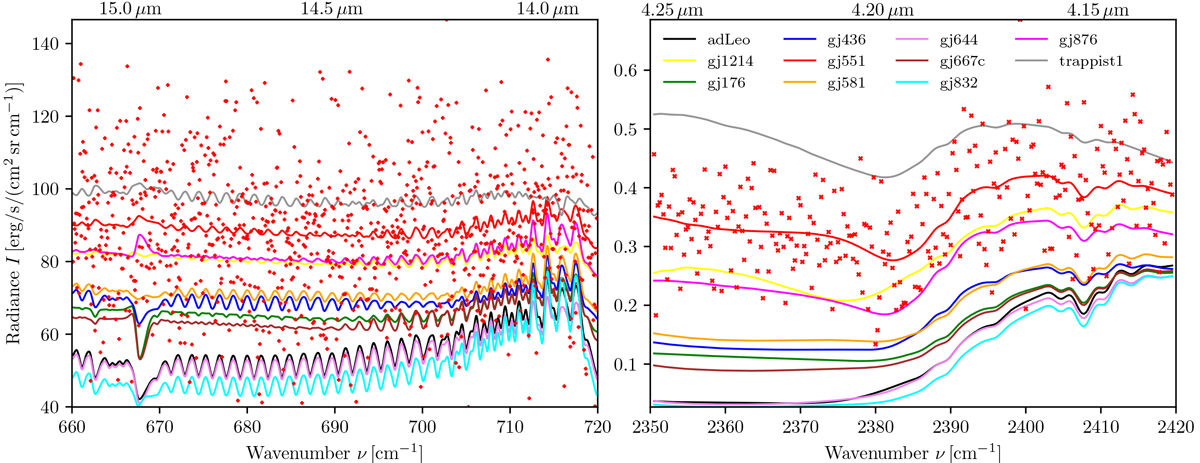
Longwave (left) and shortwave M-Earth TIR spectra. Gaussian spectral response with R ≈ 2800 (LW) and R ≈ 2400 (SW). Solid lines show the fitted model spectra. Furthermore, the noise (S∕N = 5) contaminated “observation” of GJ 551 (Proxima Centauri) is shown (red points).
Current usage metrics show cumulative count of Article Views (full-text article views including HTML views, PDF and ePub downloads, according to the available data) and Abstracts Views on Vision4Press platform.
Data correspond to usage on the plateform after 2015. The current usage metrics is available 48-96 hours after online publication and is updated daily on week days.
Initial download of the metrics may take a while.