Fig. A.1
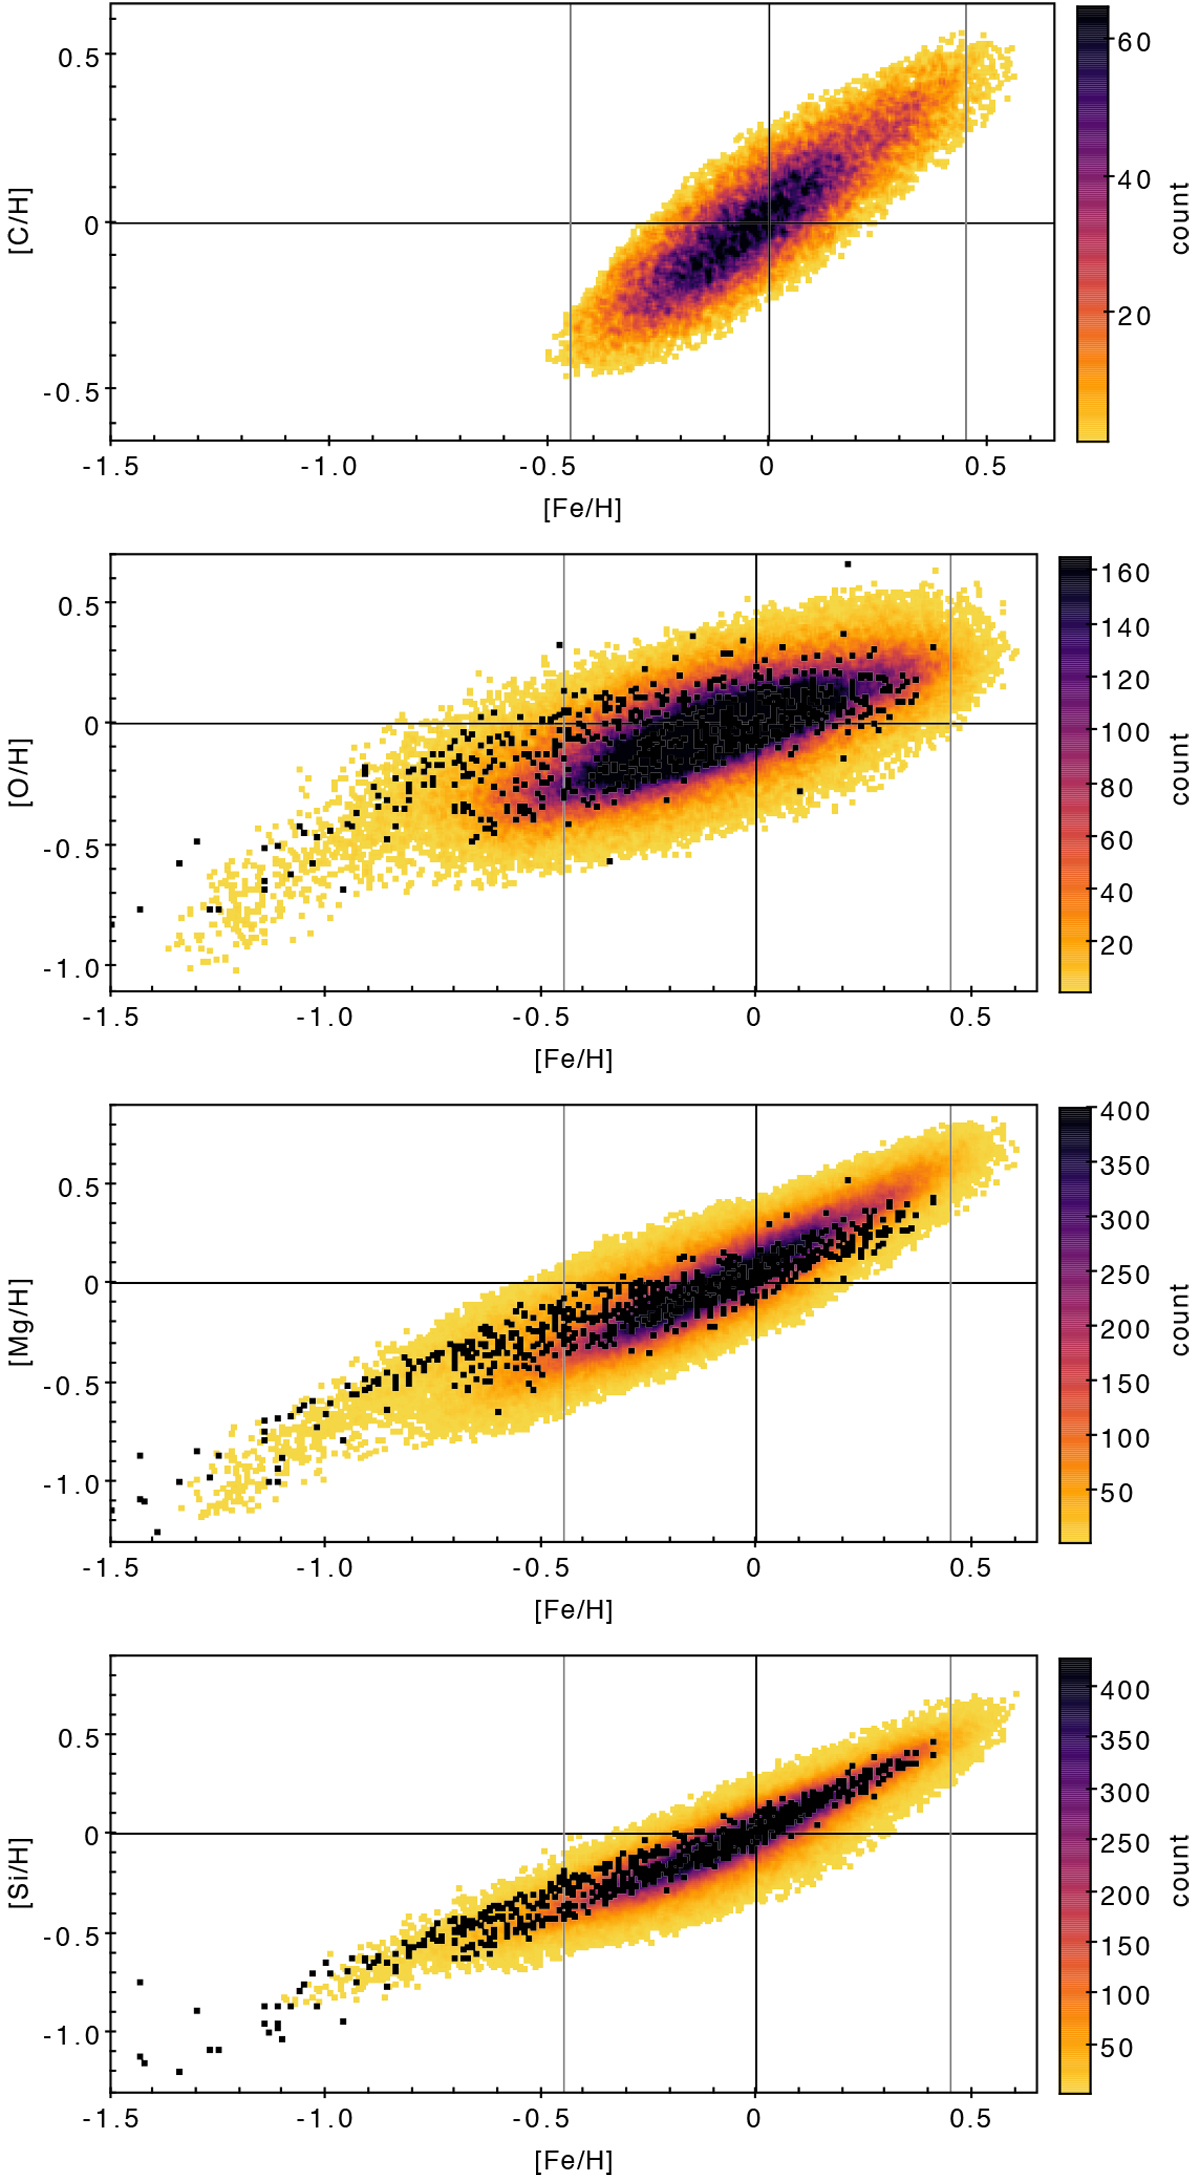
Carbon, oxygen, magnesium, and silicon abundances for the stars in the GALAH sample (Buder et al. 2018). Black dots mark the data from the detailed survey of Bensby et al. (2014), which does not include carbon. This plot illustrates that the trends of the GALAH survey agree with previous studies and that there is some variations within the sample. The black vertical lines at [Fe/H] = −0.45 and 0.45 indicate the [Fe/H] span used in Fig. 1, while the lines at [Fe/H] = 0 and [X/H] = 0 mark the solar value.
Current usage metrics show cumulative count of Article Views (full-text article views including HTML views, PDF and ePub downloads, according to the available data) and Abstracts Views on Vision4Press platform.
Data correspond to usage on the plateform after 2015. The current usage metrics is available 48-96 hours after online publication and is updated daily on week days.
Initial download of the metrics may take a while.