Fig. 5.
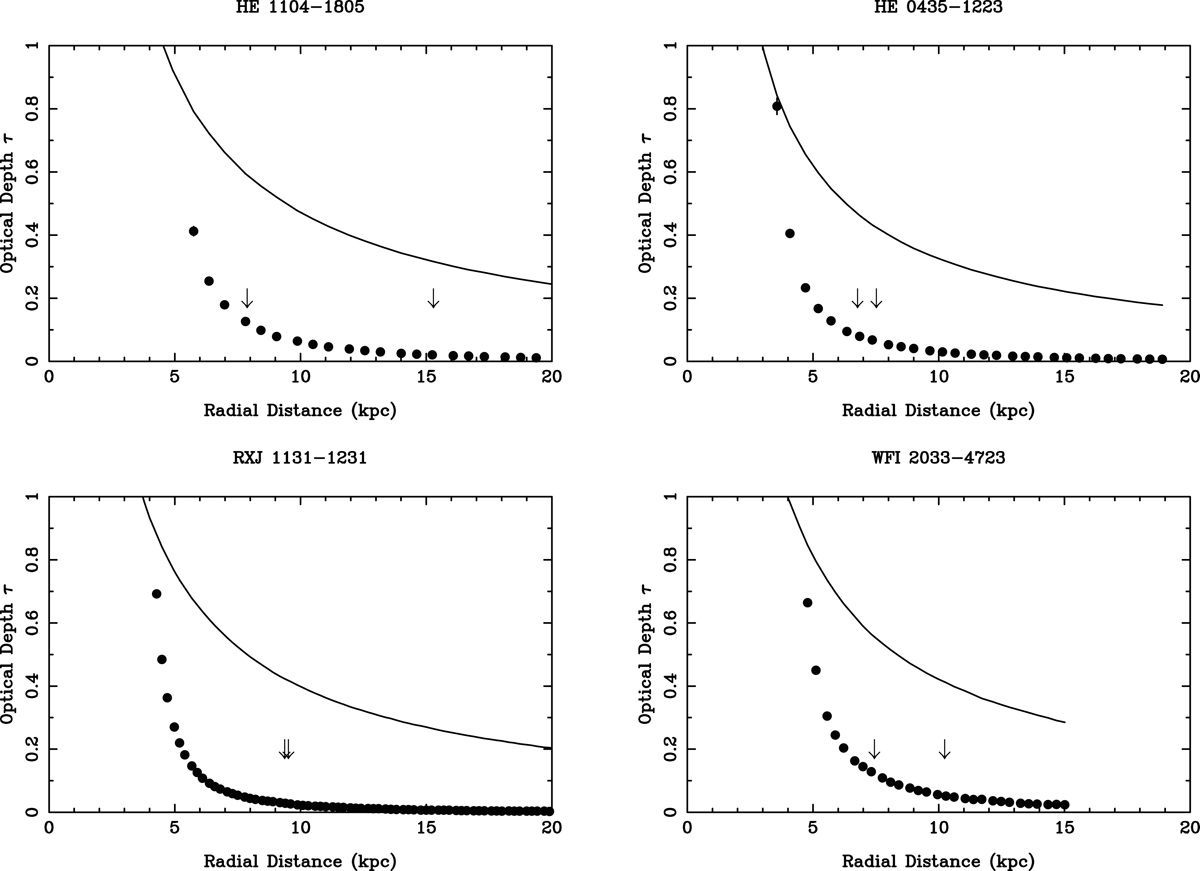
Optical depth to microlensing τ as a function of radial distance for the lensing galaxies of four gravitationally lensed quasars. The solid line shows the surface mass density in smoothly distributed matter as discussed in the text, and the filled circles show the optical depth to microlensing for the stellar population of the lensing galaxy. The arrows indicate the positions of the quasar images listed in Table 2.
Current usage metrics show cumulative count of Article Views (full-text article views including HTML views, PDF and ePub downloads, according to the available data) and Abstracts Views on Vision4Press platform.
Data correspond to usage on the plateform after 2015. The current usage metrics is available 48-96 hours after online publication and is updated daily on week days.
Initial download of the metrics may take a while.