Fig. 7
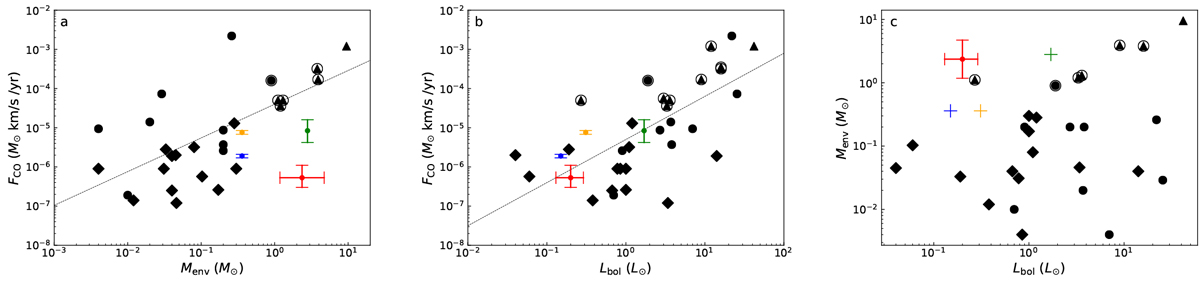
Correlation plots for (a) FCO and Menv, (b) FCO and Lbol, and (c) Menv and Lbol adapted from vdM13. Diamonds show their study, triangles the study of Cabrit & Bertout (1992) and filled circles that of Hogerheijde et al. (1996). The Class 0 protostars are encircled. The dashed lines indicate their best fit. The results for Cha-MMS1, GF 9–2 (Furuya et al. 2019), B1b-N, and B1b-S (Gerin et al. 2015) are shown in red, green, blue, and orange, respectively. The error bars on the total momentum force of the outflows represent the uncertainty on the inclination correction adapted from Cabrit & Bertout (1992). The error bars on the luminosity and the mass of Cha-MMS1 correspond to the range derived by Tsitali et al. (2013) and an uncertainty of a factor of 2 (Belloche et al. 2011), respectively. The results for Cha-MMS1 correspond to the optical depth case τ12 = 5.
Current usage metrics show cumulative count of Article Views (full-text article views including HTML views, PDF and ePub downloads, according to the available data) and Abstracts Views on Vision4Press platform.
Data correspond to usage on the plateform after 2015. The current usage metrics is available 48-96 hours after online publication and is updated daily on week days.
Initial download of the metrics may take a while.