Fig. 4
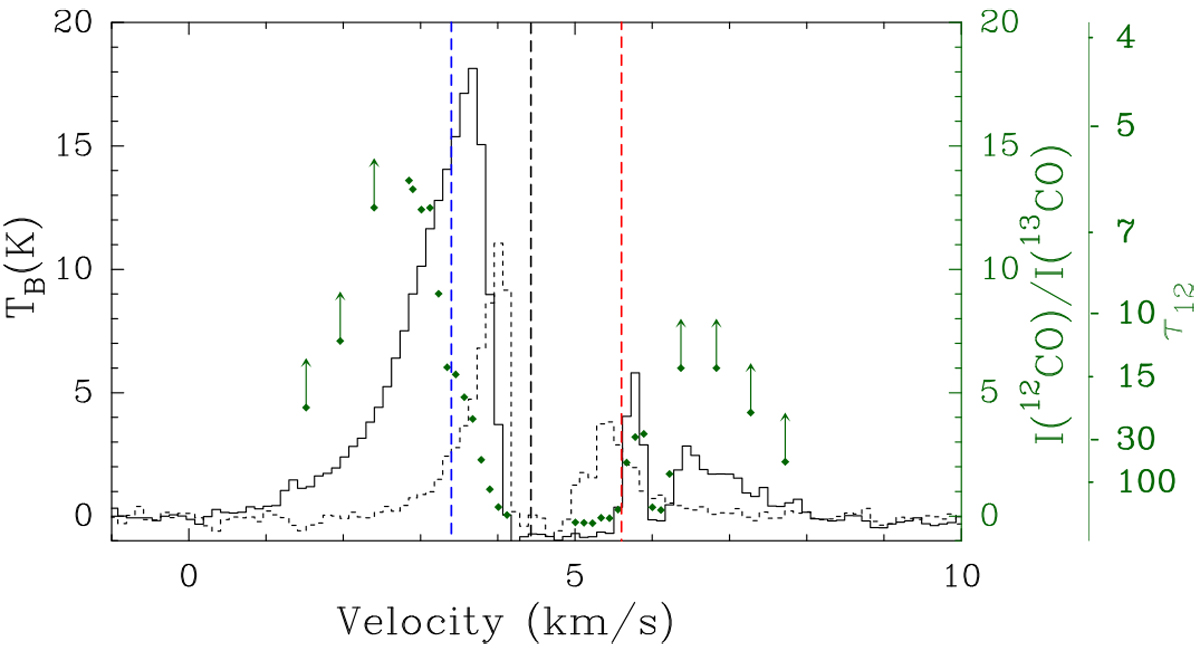
CO 3–2 (solid black) and 13CO 3–2 (dotted black) spectra at the peak position of Cha-MMS1 in brightness temperature scale. Green squares show the ratio of CO to 13CO intensity, and green arrows indicate the lower limits of this ratio after smoothing over four channels. The scale is given on the first right axis. The optical depth scale is shown on the second right axis. The red and blue dashed lines mark the inner integration limits, and the black dashed line indicates the systemic velocity of Cha-MMS1.
Current usage metrics show cumulative count of Article Views (full-text article views including HTML views, PDF and ePub downloads, according to the available data) and Abstracts Views on Vision4Press platform.
Data correspond to usage on the plateform after 2015. The current usage metrics is available 48-96 hours after online publication and is updated daily on week days.
Initial download of the metrics may take a while.