Fig. 3
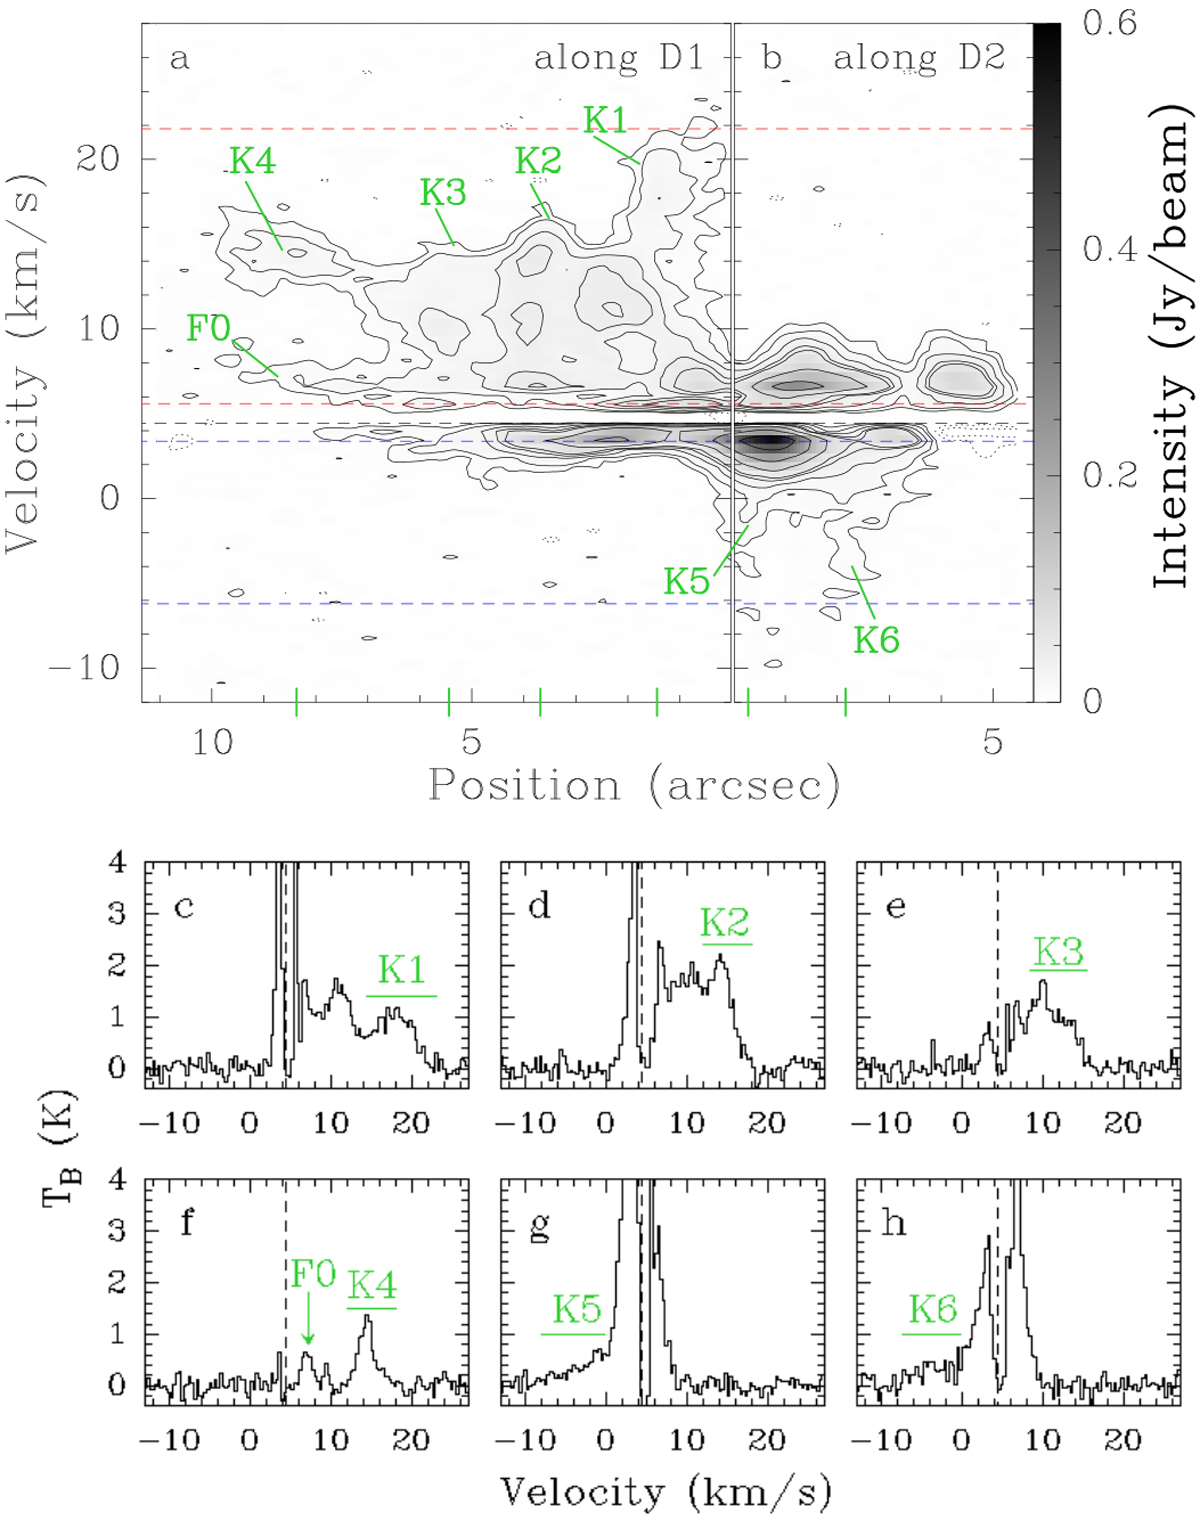
(a and b) CO 3–2 PV diagrams along the outflow axes (a) D1 and (b) D2 shown as green dashed arrows in Fig. 1a. The origin of the position axes corresponds to the continuum peak. The intensity is smoothed over five channels. The contours are − 6σ, − 3σ, 3σ, 6σ, 12σ, 18σ, 24σ 48σ, 96σ, and 192σ with σ = 2.0 mJy beam−1. The red and blue dashed lines show the inner and outer integration limits. (c–h) CO 3–2 spectra in brightness temperaturescale taken along D1 and D2 at the positions marked as green ticks on the x-axis in the PV diagrams in panels a and b. K1–K6 denote the bumps corresponding to the bullets and F0 indicates the bulk flow. The intensity is smoothed over two channels. In all panels, the black dashed line indicates the systemic velocity of Cha-MMS1.
Current usage metrics show cumulative count of Article Views (full-text article views including HTML views, PDF and ePub downloads, according to the available data) and Abstracts Views on Vision4Press platform.
Data correspond to usage on the plateform after 2015. The current usage metrics is available 48-96 hours after online publication and is updated daily on week days.
Initial download of the metrics may take a while.