Fig. 2
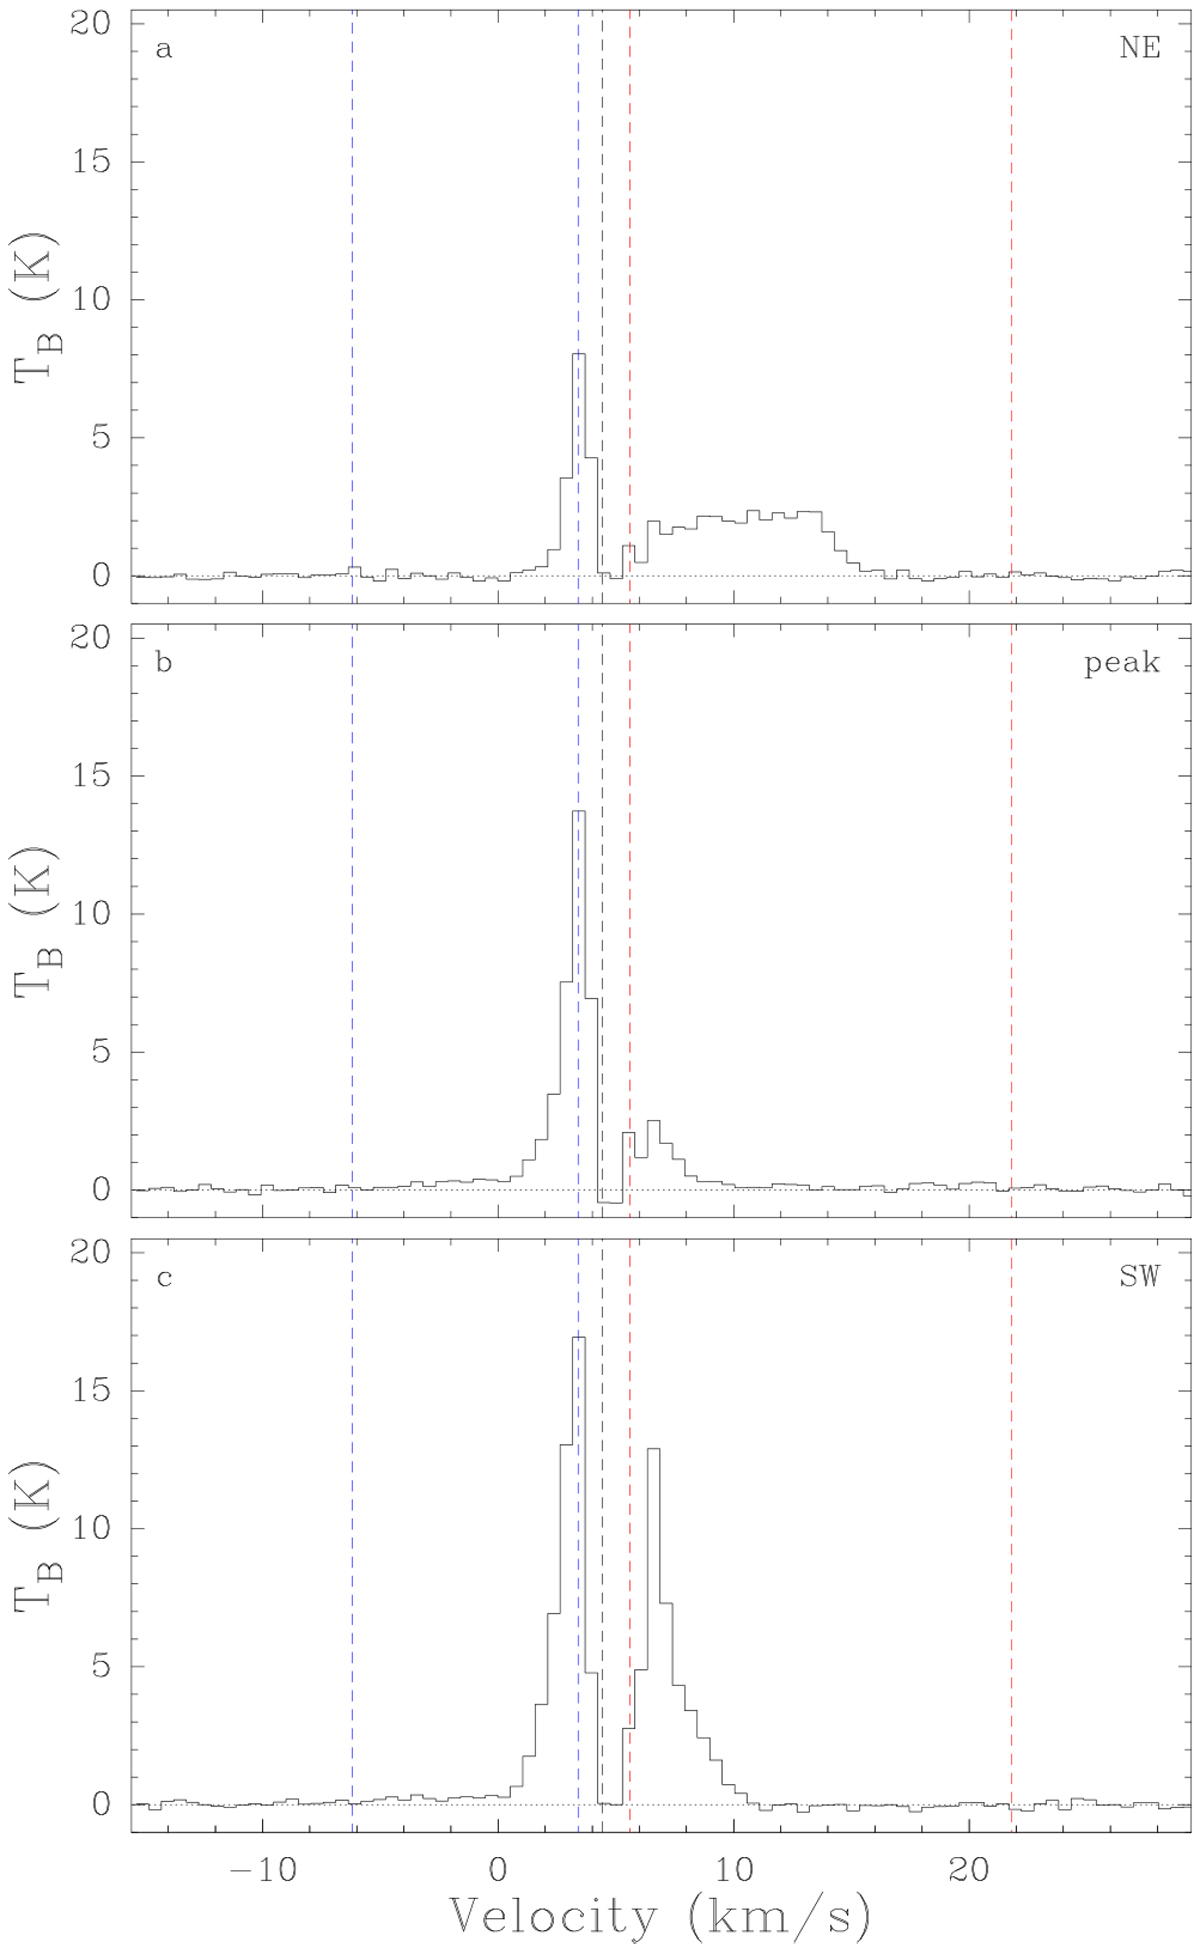
CO 3–2 spectra observed with ALMA toward Cha-MMS1 in brightness temperature scale and smoothed over five channels. The spectra are taken toward three positions marked with yellow crosses in Fig. 1: (a) in the NE lobe, (b) at the peak of the continuum emission, and (c) in the SW lobe. The red and blue dashed lines correspond to the integration intervals defined in Sect. 3.2 while the black dashed line indicates the systemic velocity of Cha-MMS1, vsys = 4.43 km s−1 (Belloche et al. 2006).
Current usage metrics show cumulative count of Article Views (full-text article views including HTML views, PDF and ePub downloads, according to the available data) and Abstracts Views on Vision4Press platform.
Data correspond to usage on the plateform after 2015. The current usage metrics is available 48-96 hours after online publication and is updated daily on week days.
Initial download of the metrics may take a while.