Fig. 1
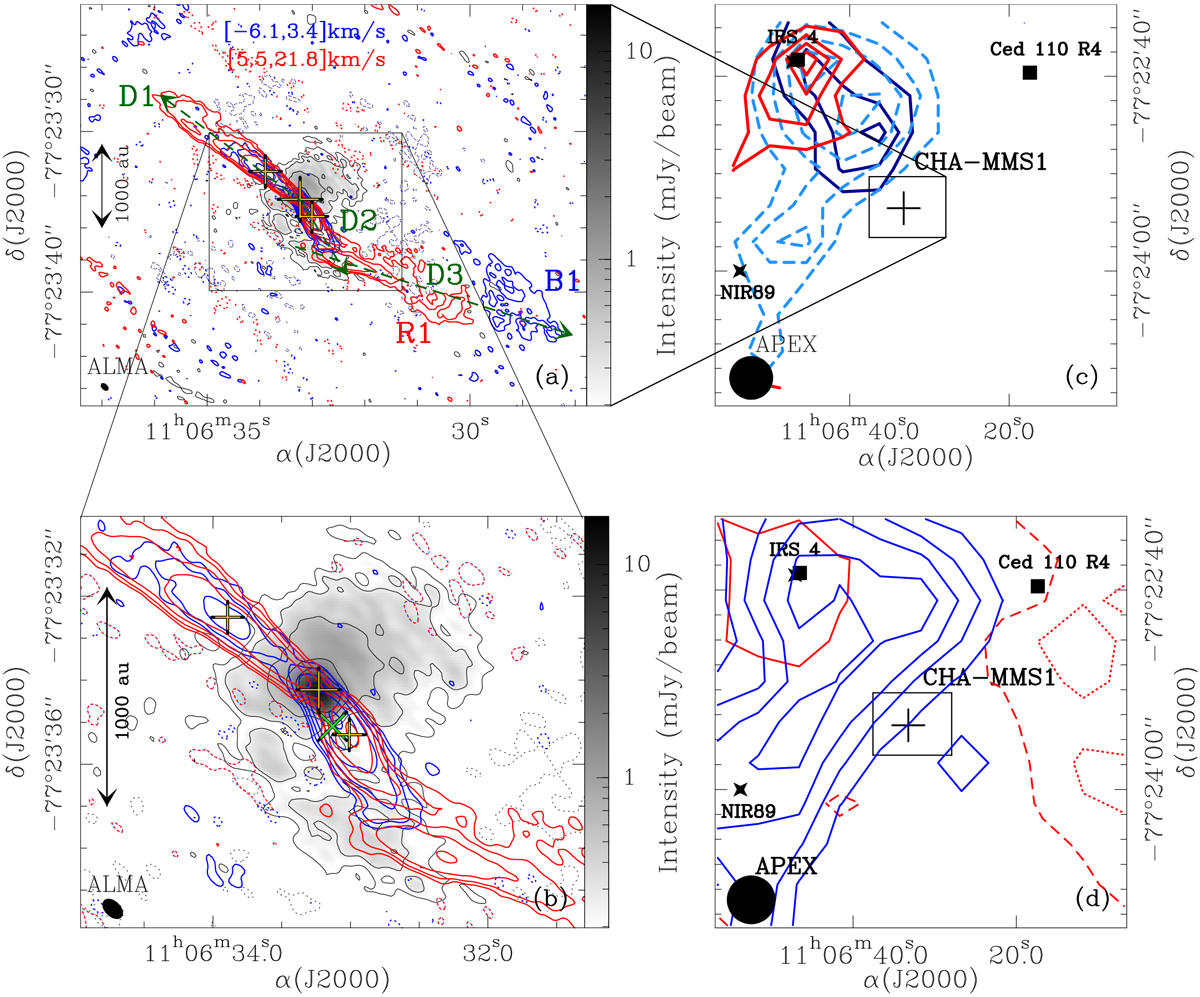
(a) CO 3–2 integrated intensities (blue and red contours) observed with ALMA toward Cha-MMS1. The continuum emission is shown in grayscale with black contours. The large yellow cross marks its peak position. The CO emission is integrated over the velocity ranges [−6.1, 3.4] km s−1 (blue) and [5.5, 21.8] km s−1 (red). The contours are − 2.5σ, 2.5σ, and 5σ, and then increase by a factor of two at each step with σ = 7.04 mJy beam−1 km s−1, 9.06 mJy beam−1 km s−1, and 0.05 mJy beam−1 for the blueshifted, redshifted, and the continuum emission, respectively. The HPBW is shown in the bottom left corner. The yellow crosses mark the positions of the spectra shown in Fig. 2. The green dashed arrows indicate the axes along which PV diagrams were taken for Figs. 3 and B.1. B1 and R1 indicate the less-collimated blue- and redshifted structures, respectively. (b) Same as a, but zoomed-in on the central region. The phase center is marked with a green cross in this panel. (c) CO 3–2 integrated intensities observed with APEX toward Cha-MMS1 (cross) (adapted from Belloche et al. 2006). The redshifted [6.6, 9.8] km s−1, blueshifted [−0.2, 1.0] km s−1, and less blueshifted [1.2, 2.4] km s−1 emission is plotted as solid red, solid blue, and dashed blue contours, respectively. The first contours and steps are 3σ, 6σ, and 3σ with σ = 0.13, 0.13, and 0.24 K km s−1, respectively, as in Belloche et al. (2006). The HPBW is shown in the bottom left corner. The star and square mark positions of NIR (Persi et al. 2001) and 3.5 cm sources (Lehtinen et al. 2003), respectively. (d) Same as c but for CO 3–2 integrated intensities at velocities close to vsys. The redshifted [5.5, 6.6] km s−1 emission is shown as dotted (3σ), dashed (6σ), and solid (9σ) contours with σ = 0.13 K km s−1. The blueshifted [2.4, 3.4] km s−1 emission is plotted as solid contours. The first contour and the steps are 6σ with σ = 0.13 K km s−1. The small box corresponds to the field of view shown in panel a.
Current usage metrics show cumulative count of Article Views (full-text article views including HTML views, PDF and ePub downloads, according to the available data) and Abstracts Views on Vision4Press platform.
Data correspond to usage on the plateform after 2015. The current usage metrics is available 48-96 hours after online publication and is updated daily on week days.
Initial download of the metrics may take a while.