Fig. 2.
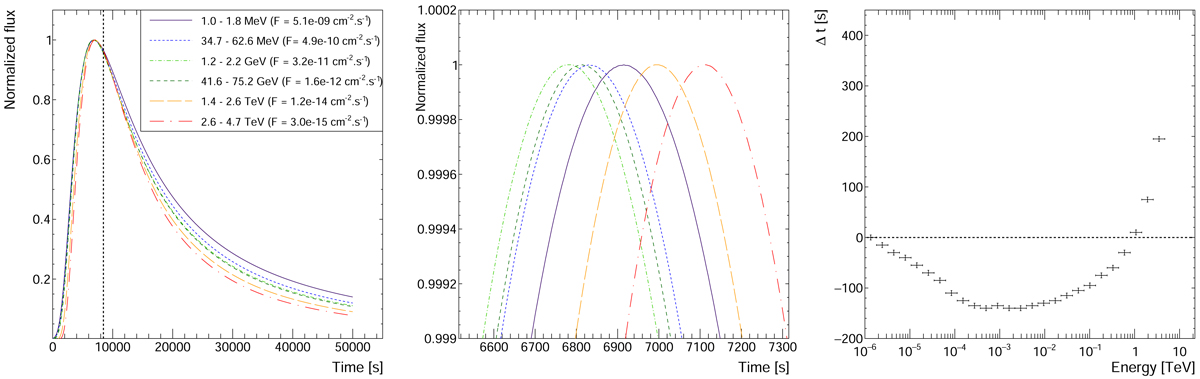
Normalized light curves (left), zoom close to the light-curve maxima (center), and time-delays between each light curve and the one in the range 1–1.8 MeV (right) obtained for the first reference set of parameters. The vertical dashed line on the light curves (left) corresponds to the time when electrons reach their maximum energy γmax and shows the moment when energy losses dominate over the acceleration at the energy γmax.
Current usage metrics show cumulative count of Article Views (full-text article views including HTML views, PDF and ePub downloads, according to the available data) and Abstracts Views on Vision4Press platform.
Data correspond to usage on the plateform after 2015. The current usage metrics is available 48-96 hours after online publication and is updated daily on week days.
Initial download of the metrics may take a while.