Fig. 13.
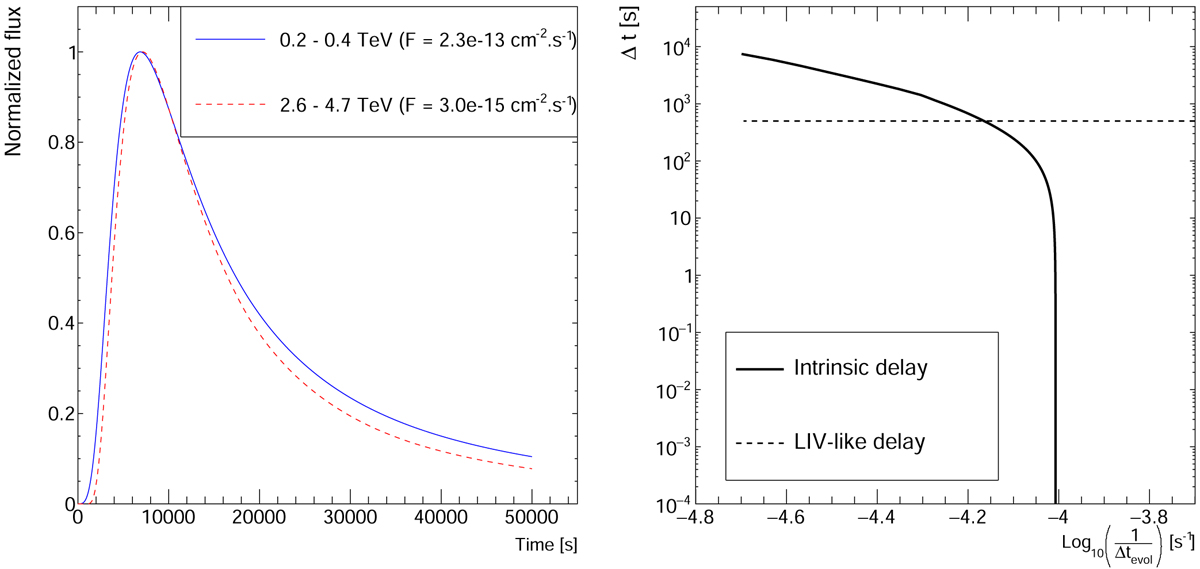
Light curves for a flare with parameters of Table 1 with B = 65 mG for two energy bands (left) and evolution of the simulated time delays between them as a function of time (right). The LIV-like delay overlaid for comparison has been obtained by simulating two asymmetric Gaussian light curves with an injected constant delay of Δt = 500 s. Only positive delays are shown here in logarithmic scale, which can be directly compared to the Lewis et al. (2016) description.
Current usage metrics show cumulative count of Article Views (full-text article views including HTML views, PDF and ePub downloads, according to the available data) and Abstracts Views on Vision4Press platform.
Data correspond to usage on the plateform after 2015. The current usage metrics is available 48-96 hours after online publication and is updated daily on week days.
Initial download of the metrics may take a while.