Fig. 12.
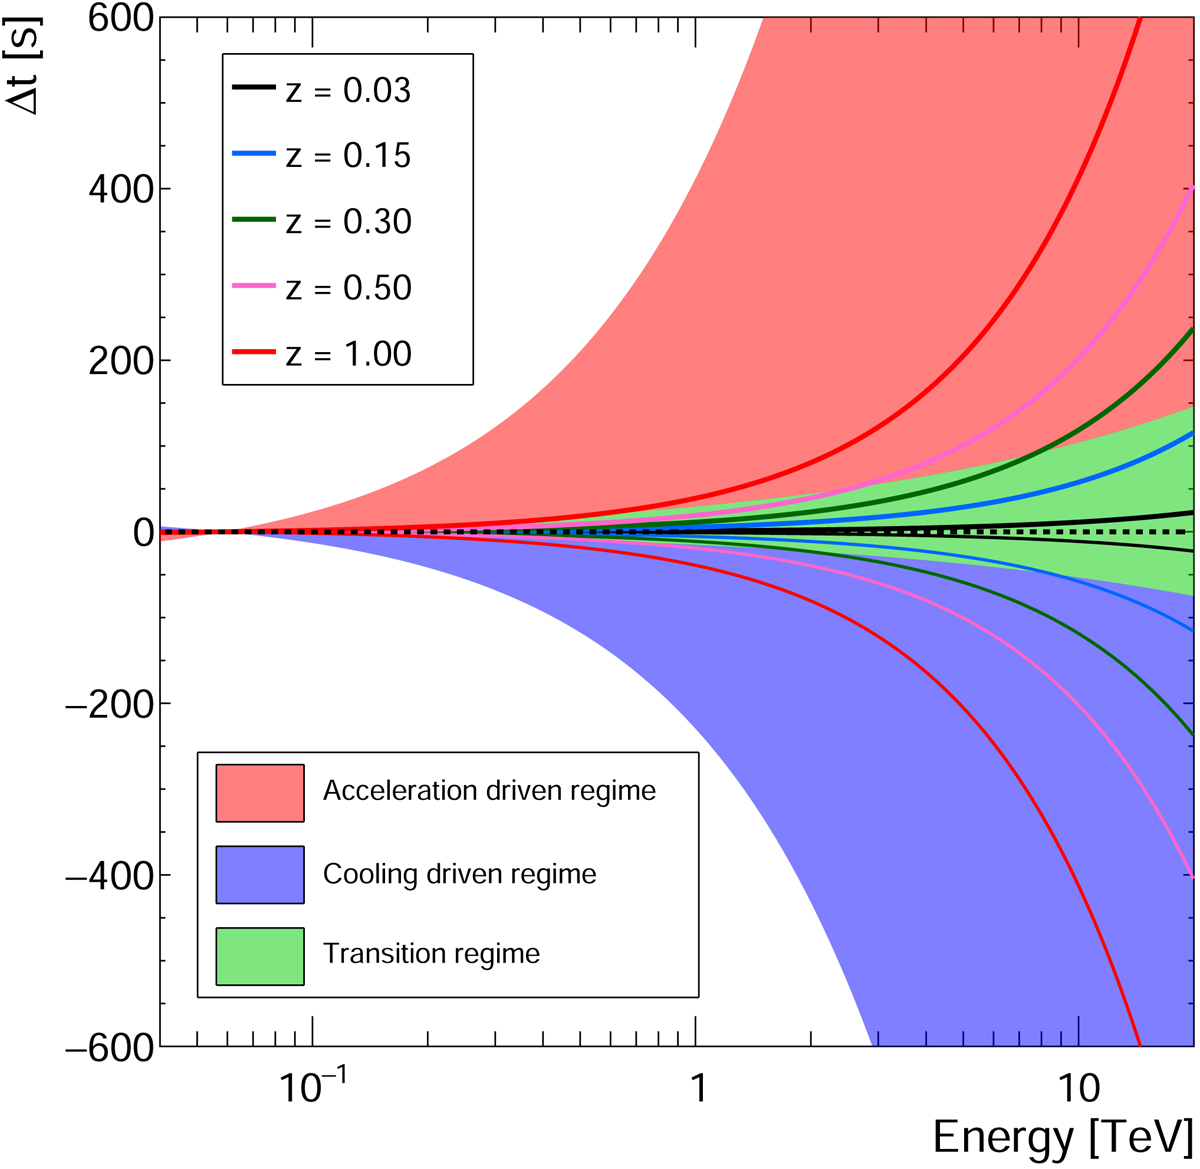
Typical time delays obtained from the SSC flare model (shaded area) and expected from a linear LIV effect with an energy scale at the Planck energy (full lines) with the redshift evolution found in Jacob & Piran (2008). Other formalism such as DSR would lead to different values but of the same order of magnitude. The dashed line corresponds to Δt = 0. Positive and increasing LIV delays correspond to subluminal LIV effects, negative and decreasing ones to superluminal LIV effects.
Current usage metrics show cumulative count of Article Views (full-text article views including HTML views, PDF and ePub downloads, according to the available data) and Abstracts Views on Vision4Press platform.
Data correspond to usage on the plateform after 2015. The current usage metrics is available 48-96 hours after online publication and is updated daily on week days.
Initial download of the metrics may take a while.