Fig. 1.
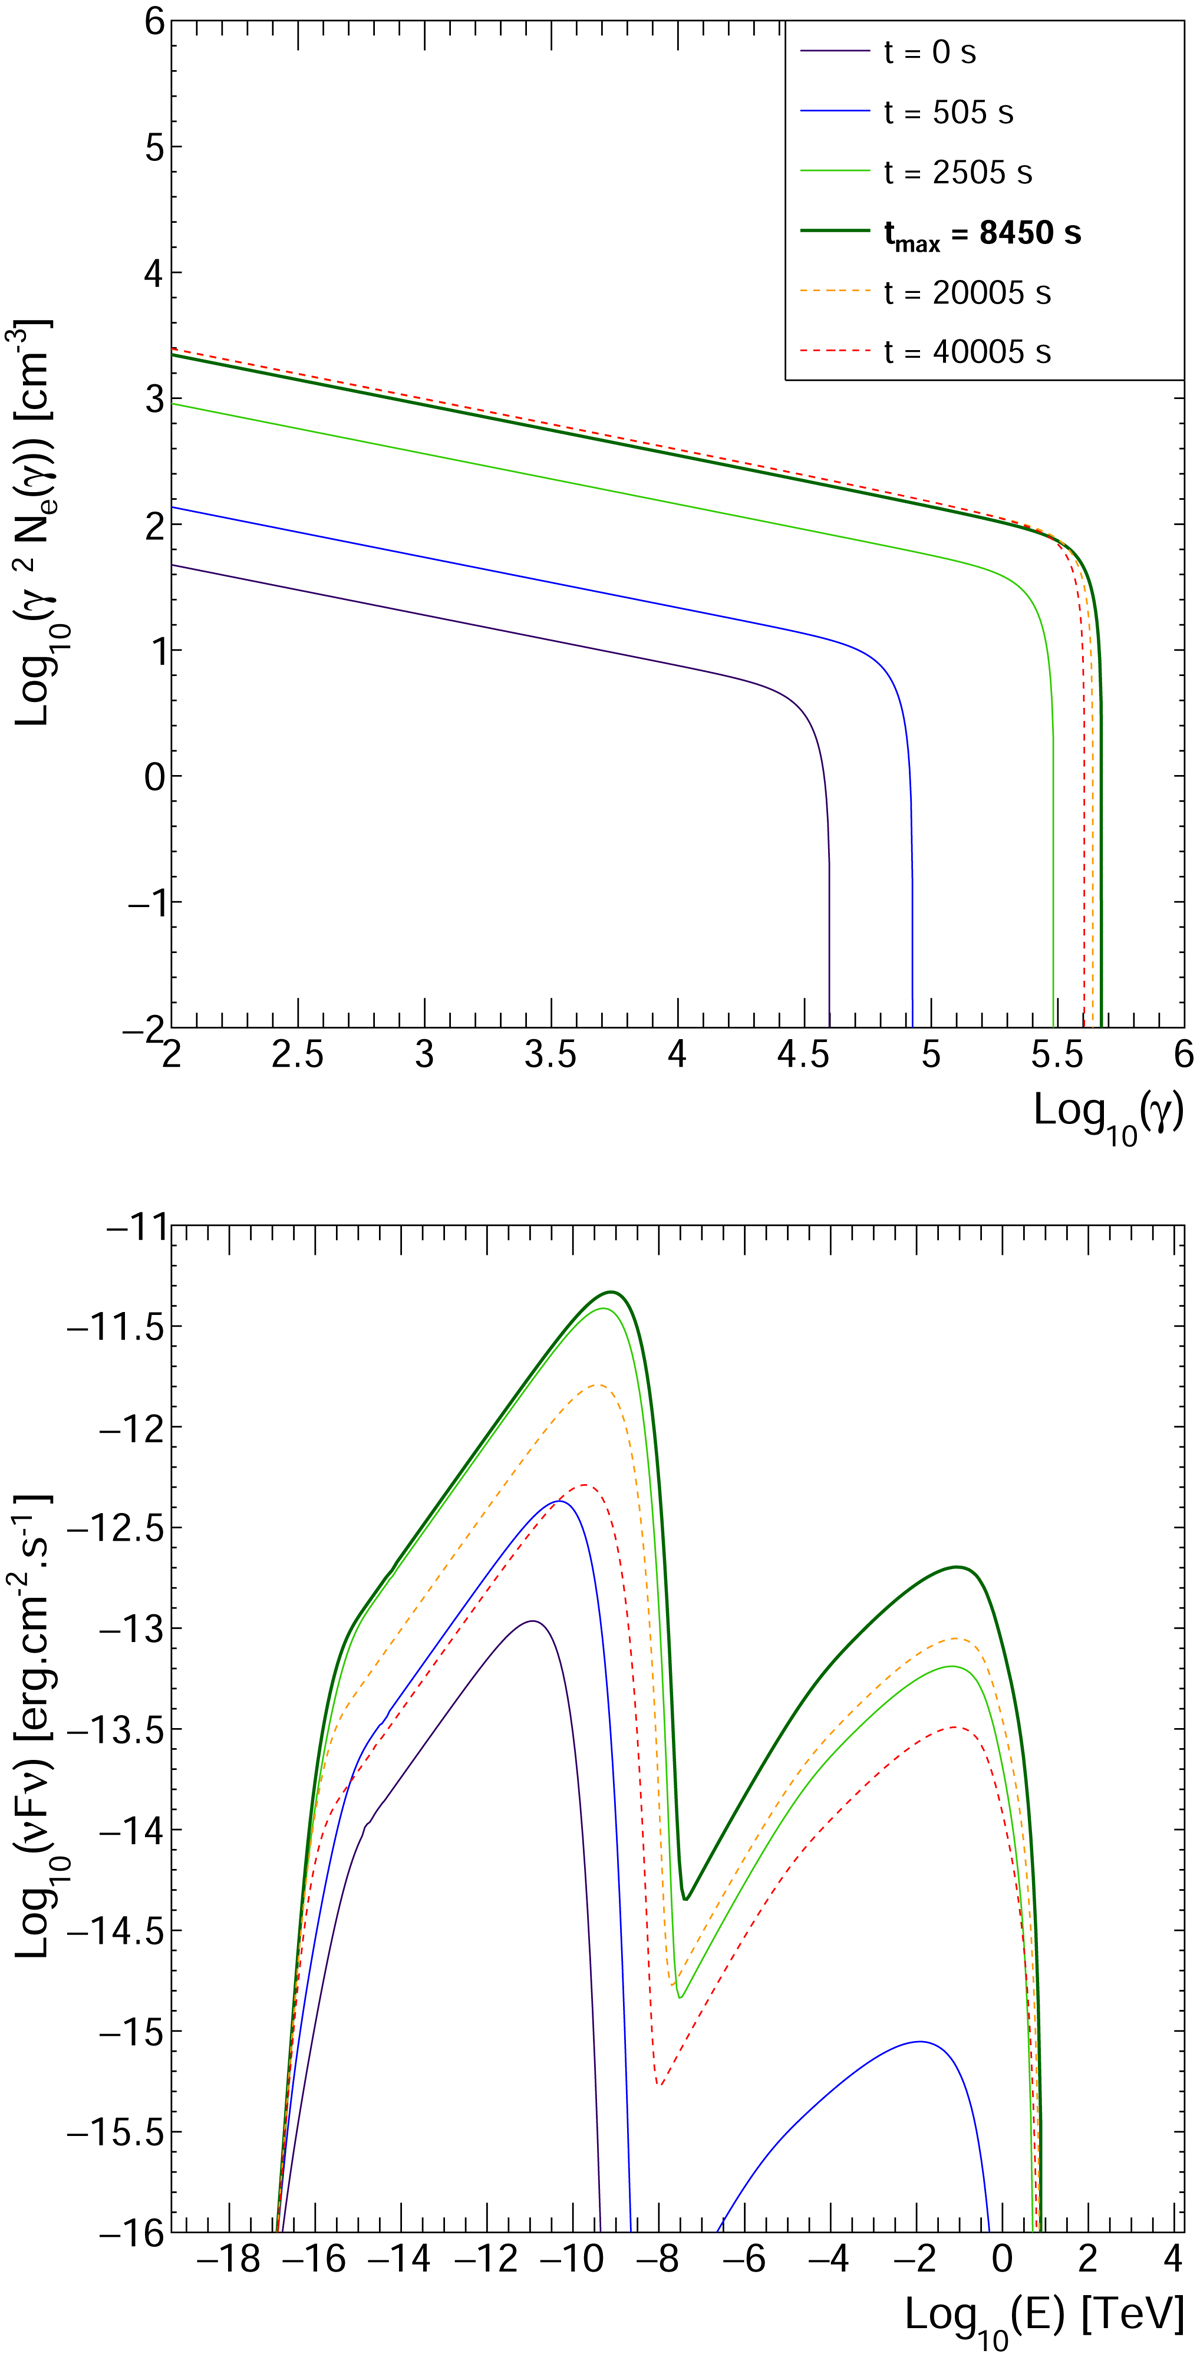
Electron spectrum (top) and SED (bottom) evolution for the reference set of parameters given in Table 1, illustrating a typical TeV blazar flare. The two plots share the same color code. The full lines correspond to the rising phase of the flare and the dashed lines to its decay. The time tmax is defined as the time when the highest energy value γmax = max[γc(t)] is reached in the electron spectrum. The corresponding electron spectrum and SED are plotted in thick lines. The electron spectrum and SED at the maximum luminosity of the flare are not displayed because they almost coincide with the ones at tmax for this reference set of parameters.
Current usage metrics show cumulative count of Article Views (full-text article views including HTML views, PDF and ePub downloads, according to the available data) and Abstracts Views on Vision4Press platform.
Data correspond to usage on the plateform after 2015. The current usage metrics is available 48-96 hours after online publication and is updated daily on week days.
Initial download of the metrics may take a while.