Free Access
Fig. 4.
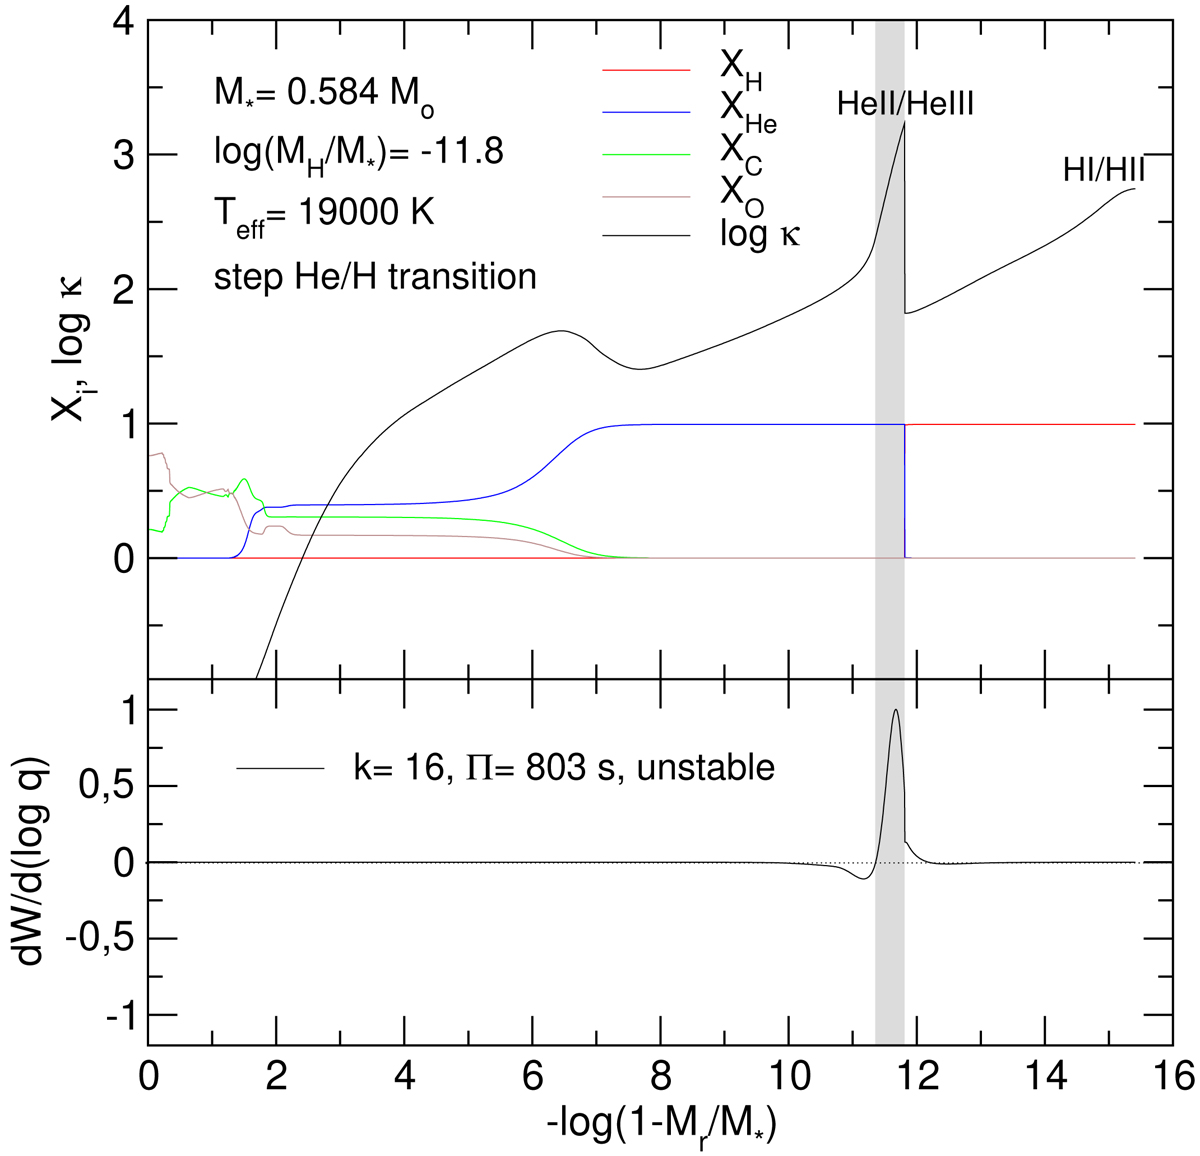
Upper panel: same as in Fig. 2, but for the extreme case in which the H–He interface is assumed to be discontinuous (step-like shape). The vertical gray strip marks the convection zone driven by the second ionization of He. Lower panel: differential work function for an unstable g mode with k = 16 and period Π = 803 s.
Current usage metrics show cumulative count of Article Views (full-text article views including HTML views, PDF and ePub downloads, according to the available data) and Abstracts Views on Vision4Press platform.
Data correspond to usage on the plateform after 2015. The current usage metrics is available 48-96 hours after online publication and is updated daily on week days.
Initial download of the metrics may take a while.