| Issue |
A&A
Volume 633, January 2020
|
|
|---|---|---|
| Article Number | A39 | |
| Number of page(s) | 12 | |
| Section | Atomic, molecular, and nuclear data | |
| DOI | https://doi.org/10.1051/0004-6361/201936230 | |
| Published online | 08 January 2020 | |
Photolysis of diatomic molecules as a source of atoms in planetary exospheres⋆
1
University of Helsinki, Department of Chemistry, PO Box 55, A.I. Virtanens Plats 1, 00014 Helsinki, Finland
e-mail: This email address is being protected from spambots. You need JavaScript enabled to view it.
2
Research School of Chemistry and Applied Biomedical Sciences, Tomsk Polytechnic University, Lenin Avenue 30, Tomsk 634050, Russia
3
Sternberg Astronomical Institute, Moscow State University, 13, Universitetskij pr., 119234 Moscow, Russia
4
Tomsk State University, 36 Lenin Avenue, 634050 Tomsk, Russia
5
Tomsk State University of Control Systems and Radioelectronics, 40 Lenin Avenue, 634050 Tomsk, Russia
6
Image Analysis Group, Technical University of Dortmund, Otto-Hahn-Str. 4, 44227 Dortmund, Germany
Received:
3
July
2019
Accepted:
24
July
2019
Abstract
We calculated the cross sections of photolysis of OH, LiO, NaO, KO, HCl, LiCl, NaCl, KCl, HF, LiF, NaF, and KF molecules using quantum chemistry methods. The maximal values for photolysis cross sections of alkali metal monoxides are on the order of 10−18 cm2. The lifetimes of photolysis for quiet Sun at 1 astronomical unit are estimated as 2.0 × 10⁵, 28, 5, 14, 2.1 × 10⁵, 225, 42, 52, 2 × 10⁶, 35 400, 486, and 30 400 s for OH, LiO, NaO, KO, HCl, LiCl, NaCl, KCl, HF, LiF, NaF, and KF, respectively. We performed a comparison between values of photolysis lifetimes obtained in this work and in previous studies. Based on such a comparison, our estimations of photolysis lifetimes of OH, HCl, and HF have an accuracy of about a factor of 2. We determined typical kinetic energies of main peaks of photolysis-generated metal atoms. Impact-produced LiO, NaO, KO, NaCl, and KCl molecules are destroyed in the lunar and Hermean exospheres almost completely during the first ballistic flight, while other considered molecules are more stable against destruction by photolysis.
Key words: meteorites / meteors / meteoroids / stars: kinematics and dynamics / molecular processes / molecular data / sradiation mechanisms: general / ultraviolet: planetary systems
Tables of the cross-sections are only available at the CDS via anonymous ftp to cdsarc.u-strasbg.fr (130.79.128.5) or via http://cdsarc.u-strasbg.fr/viz-bin/cat/J/A+A/633/A39
© ESO 2020
1. Introduction
The photodissociation of diatomic molecules is an important source of atoms in various celestial objects. Comprehensive reviews of photodissociation cross sections of molecules of astrophysical interest have been published (Huebner et al. 1992; Huebner & Mukherjee 2015; Heays et al. 2017). Simple molecules can be delivered to the exospheres of Mercury and the Moon during meteoroid bombardment (Berezhnoy & Klumov 2008; Berezhnoy 2013). Volcanic eruptions are main sources of chlorides and fluorides of alkali elements in the atmosphere of Io (Schaefer & Fegley 2005). Subsequent photolysis of alkali chlorides is an important source of Na and K atoms in the exosphere of Io (Moses et al. 2002).
Observations of emission lines of metal atoms in exospheres of bodies of the solar system have a long history. Atoms of Na, K, Al, and Fe have been detected in the exosphere of Mercury (Cassidy et al. 2015; Bida & Killen 2017). The content of Na and K atoms in the lunar exosphere was studied with the lunar orbiter, the Lunar Atmosphere and Dust Environment Explorer (LADEE; Colaprete 2016); Na atoms were also detected in the exospheres of Io and Europa (Brown & Hill 1996; Mendillo et al. 2007). Metal atoms generated during photolysis of metal-containing species are generally hotter than those formed during chemical reactions in the impact-produced clouds (Berezhnoy 2018). For example, high observed temperatures of Al and Fe atoms in the Hermean exosphere are explained by photolysis of Al-, and Fe-containing species (Bida & Killen 2017).
NaCl and KCl molecules were detected in the circumstellar envelope IRC +10216 (Agúndez et al. 2012). KCl was tentatively detected in the atmosphere of Io (Moullet et al. 2013). NaCl and KCl may be also abundant at the surface of Mercury (Evans et al. 2015). Chlorides of alkali elements are expected to be present in cool dwarf atmospheres (Lodders 1999), in clouds of super-Earth atmospheres (Mbarek & Kempton 2016), and in lunar volcanic gases (Renggli et al. 2017). Rotation-vibration line lists for considered diatomic molecules in their ground electronic states have been published for NaCl and KCl by Barton et al. (2014) and for LiCl and LiF by Bittner & Bernath (2018), and the same transitions and others have been studied recently by Wan et al. (2015). HCl and HF molecules were detected in the coma of comet Churyumov-Gerasimenko (De Keyser et al. 2017; Dhooghe et al. 2017) and in interstellar medium (Indriolo et al. 2013; Monje et al. 2013), while HCl was also detected in the atmosphere of Venus (Sandor & Clancy 2012). Detailed studies of HCl and HF photolysis are required for deeper understanding of chlorine and fluorine behavior in the interstellar medium (Acharyya & Herbst 2017); HF absorption has been studied ab initio by Li et al. (2010) and Brown & Hill (1996), and experimentally by Brown & Hill (1996). The OH radical is one the main molecular species in the Universe and has been detected at the surface of on the Moon, in cometary atmospheres, and in many other objects (Litvak & Sanin 2018). The OH radical is the most important oxidant in the Earth’s troposphere, and both OH and HCl participate in ozone-depleting catalytic cycles in the stratosphere.
The main parameters of photolysis of species in planetary exospheres are photolysis lifetimes and kinetic energies of products of photolysis (Huebner et al. 1992). For an estimation of these parameters, knowledge of the wavelength dependence of the photolysis cross section of studied species is required. The ultraviolet-absorption cross sections for alkali halides such as LiCl, NaCl, and KCl were measured by Davidovits & Brodhead (1967). The photodissociation cross section of NaCl was also measured by Silver et al. (1986). However, similar studies of alkali fluorides have not been performed yet. Based on experimental measurements of photodissociation cross sections, photolysis lifetimes of chlorides, bromides, and iodides of Li, Na, and K were estimated by Schaefer & Fegley (2005). Alkali and chlorine photochemistry in the atmosphere of Io was studied in detail by Moses et al. (2002). Analysis of observations of Io’s sodium exosphere during a solar eclipse performed by Grava et al. (2014) agrees with an estimation of the lifetime of NaCl photolysis carried out by Schaefer & Fegley (2005). The photolysis lifetime of OH in the gas phase and on the surface of the Moon is an important parameter for correct modeling of the behavior of hydrogen-containing species on the Moon (Grumpe et al. 2019).
Photolysis cross sections of gas-phase molecules are usually obtained experimentally (Huebner et al. 1992). There are only a few papers devoted to theoretical studies of photolysis of diatomic molecules, especially OH (van Dishoeck & Dalgarno 1983; Lee 1995) and HCl (van Dishoeck et al. 1982). Previously, we also developed the original quantum-chemical model to estimate the photolysis cross section of diatomic molecules and applied this applied this model to studies of photodissociation of LiO, NaO, KO, MgO, and CaO (Valiev et al. 2017). However, other important diatomic molecules such as alkali metal chlorides, bromides, and hydrides of O, F, and Cl were not considered by Valiev et al. (2017). The goal of this paper is to estimate photodissociation cross sections and photolysis lifetimes of diatomic molecules OH, HF, LiF, NaF, KF, HCl, LiCl, NaCl, and KCl, and the energies of photolysis-generated Li, Na, K, and H atoms using modern ab initio quantum-chemical codes and the improved model of Valiev et al. (2017). Also, we investigate the LiO, NaO and KO molecules using the improved and corrected model because the saddle point method of integral evaluation was previously not correctly applied (Valiev et al. 2017). We consider the well-known molecules OH, HF, and HCl in order to estimate the accuracy of our model by comparing to our results with available experimental and theoretical studies. In the present paper all appeared integrals are calculated explicitly, analytically, or numerically with high accuracy. Knowledge of the parameters of photolysis of these molecules is important for investigations of the behavior of alkali elements in planetary exospheres, atmospheres of cool stars, exoplanets, and envelopes of evolved stars.
2. Theory and quantum chemical model
The description of our model and computational details of calculations are considered in this chapter. In the first subsection of theory the main formulas are described and the description of quamtum chemical methods is given in the second subsection.
2.1. The theory
The rate of photolysis J of considered molecules by solar photons at 1 AU from Sun can be written as
 (1)
(1)
where σ is the photolysis cross section, Φ is the unattenuated solar photon flux at 1 AU heliocentric distance, and λbind is the wavelength of photons corresponding to the binding energy including the vibrational zero-point correction (Huebner et al. 1992). The calculation of J can be carried out numerically using the dataset of known values of photolysis cross sections and solar photons flux in the chosen region of electromagnetic spectrum.
Considering the laws of conservation of energy and momentum, the kinetic energy of metal atoms Ekin_i (Me) formed during photolysis of a metal diatomic molecule Me–X (where X=O, F, or Cl ) at ith electronic transition can be calculated as
 (2)
(2)
where E(λi) is the energy of photons corresponding to wavelength of maximal photolysis cross section of ith electronic transition, E(λbind) is the binding energy of the considered bound Me–X, and Ar(Me) and Ar(X) are the atomic masses of considered metal atom and atom X, respectively. Equation (2) is valid if photolysis-generated metal atoms are formed in the ground electronic state.
Photolysis cross sections for atmospheric gases are obtained mainly based on laboratory experiments (Huebner & Mukherjee 2015), but the photolysis of OH (van Dishoeck & Dalgarno 1983; Lee 1995; van Dishoeck et al. 1984), HF (Brown & Balint-Kurti 2000), and HCl (Engin et al. 2012; Alexander et al. 1993; Lambert et al. 1998; Regan et al. 2000; Duhoo & Pouilly 1995) were also studied theoretically. Among considered diatomic molecules, the photolysis of NaO was studied experimentally (Self & Plane 2002), and there are also experimental values of photolysis lifetimes for OH, HF, HCl, LiCl, NaCl, and KCl (Huebner & Mukherjee 2015; Schaefer & Fegley 2005).
Diatomic molecules can have bound and unbound electronic states (Valiev et al. 2016; Langhoff et al. 1986). For the case of photolysis reactions after absorption of a photon, these molecules appear in excited vibronic states of the continuous spectrum. The photolysis cross section (σ) for such transitions can be calculated as (Riess 1972; Herzberg 1989)
 (3)
(3)
where Ψf(r, R) is the vibronic wave function of a molecule at the final excited state of continuous spectrum of energy, Ψi(r, R) is the vibronic wave function at the initial state of the molecule at the bound state of discrete spectrum of energy, E is the energy difference between initial and final states, d is the dipole moment operator of the molecule, c is the speed of light, R is the nuclear coordinate, and r is the electronic coordinate. In this section and throughout the paper all formulas are written in the atomic unit system.
When the adiabatic approximation is fulfilled, the initial and final wave functions can be written in the form
 (4)
(4)
In this equation, χcont(R) is the nuclear wave function of the molecule for a continuous spectrum, and χin(R) is the nuclear wave function of the molecule for discrete spectrum. The functions ψf(r, R) and ψi(r, R) are the electronic wave functions for the electronic states i and f of the molecule, respectively.
For diatomic molecules, when the environment temperature is close to zero (in K), the function χin(R) can be considered as the function of a harmonic oscillator for the ground vibrational state, i.e.,
 (5)
(5)
where m is the reduced mass of a molecule, ω is the harmonic frequency of molecular vibration at the ground electronic state, and R0 is the equilibrium position (or equilibrium bond length) of a molecule. The form of nuclear wave function χcont(R) depends on the decay channel (dissociation channel). We consider the possible decay channels in detail in the next Section.
Previously, we considered the three most probable channels of molecular photodissociation in the framework of the Franck–Condon approximation (Valiev et al. 2017): (1) decay (dissociation) in a ground electronic state, (2) decay in a bound excited electronic state, and (3) decay in an unbound excited electronic state. The integral estimation saddle point method was used for the estimation of photolysis cross section for all channels. However, detailed numerical integration showed that σ is negligible (σ ≪ 10−41 cm2) for the first two channels of all considered molecules, and therefore we concluded that the considered saddle point method was applied incorrectly, and only the third channel has a large value of σ. In the present work, the value of σ is calculated numerically without any integral estimation. Dissociation in an excited unbound electronic state is illustrated in Fig. 1.
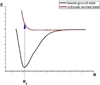 |
Fig. 1. Photodissociation of diatomic molecules in the unbound excited state. |
The potential energy curve of the unbound state in Fig. 1 can be represented using the analytical function as U(R) = Aexp(−BR), where A and B are exponential constant parameters. For this case, the vibrational wave function can be written as (Brems 1998)

In this equation, K is the Macdonald function and ε is the energy, which is counted from the predissociation limit. In this case, the σ is written as
 (6)
(6)
where Eif is the dissociation energy of electronic state f, and  is the electric dipole moment for the vertical electronic transition between pure spin electronic states, which is shown in Fig. 1 by an arrow.
Thus, the working formula for the σ calculation is obtained for dissociation in the unbound electronic excited state. We note that the other photodissociation channels are possible through the participation of nonadiabatic and spin-orbital coupling interactions effects (Minaev 2007). However, usually the spin-orbital coupling interaction between the excited states is small for light atoms, and therefore the transition moment ( ) between the spin-mixed states is negligible in the comparison with
  for the pure spin state (Valiev & Minaev 2016). Also, nonadiabatic effects only play a main role when
  is zero and the Franck–Condon approximation is not valid (Baryshnikov et al. 2015). In the case of alkali oxides, chlorides, and fluorides, heavy atoms are absent, and
  is not zero for any of the considered electronic transitions. Thus, we can conclude that photodissociation in the unbound excited state is the main channel for the considered molecules, and gives the maximum contribution to σ. Nevertheless, we consider the nonadiabatic effects in photolysis process as well.
In order to calculate σ using Eq. (6), we require knowledge about the potential energy curves of diatomic molecules. We used quantum chemical calculations based on current ab initio methods to obtain these values.
2.2. Computational details
The potential energy curves of all molecules were obtained using the extended quasi-degenerate perturbation theory of second order (XMC-QDPT2) (Granovsky 2011). The use of this method leads to the calculation of  for the all considered electronic states. We note that the XMC-QDPT2 method was applied to investigation of electronic and magnetic properties of small and large molecules and led to a good agreement with the experimental measurements (Baryshnikov et al. 2016; Valiev et al. 2013, 2014, 2016; Minaev et al. 2015).
Previously we showed that the photodissociation in the first dissociation limit leads to the largest contribution (90%) to the rate constant of photolysis due to the solar flux strongly decreasing at the increase of photon frequency (Valiev et al. 2016). Therefore, in this work we only considered potential energy curves corresponding to the first dissociation limit. The details of XMC-QDPT2 calculation for each molecule are given below.
The complete active space self-consistent field (CASSCF) was included 7 electrons in 12 molecular orbitals (MOs), 8 electrons in 9 MOs, 8 electrons in 10 MOs, 7 electrons in 12 MOs, 8 electrons in 12 MOs, 10 electrons in 9 MOs, 5 electrons in 13 MOs, 14 electrons in 12 MOs, 16 electrons in 12 MOs, 7 electrons in 10 MOs, 16 electrons in 13 MOs, and 8 electrons in 8 MOs for OH, HF, HCl, LiO, LiF, LiCl, NaO, NaF, NaCl, KO, KF and KCl, respectively. The effective Hamiltonian included 30 electronic states. The state averaging was performed on 6 states for LiO, NaO, KO, 4 states for hydroxyl, 3 states for the HCL, and 4 states for the rest molecules. The aug-cc-pv5z basis set for HF and aug-cc-pvqz for the other molecules were used. The effective Hamiltonian included 35 states. The quantum chemical calculation was performed using the Firefly software (Granovsky 2012). The numerical calculation of the photolysis cross section via formula (6) was carried out in Mapple 14 (2010).
3. Results and discussion
This section presents the results of calculations of dipole moments of electronic transitions, cross sections, and photolysis times, as well as the kinetic energy of decomposition products, such as alkali metal atoms, chlorine, fluorine, and oxygen, in the process of photolysis (see Figs. 2–4, and Table A.1). Also, the dependence of the electric dipole transition moments on the internuclear distance around the equilibrium position of the electronic ground state was calculated for all molecules. We calculated this value at two points: 0.05 Angstrom shortward and longward of the equilibrium point of the electronic ground state. According to the discussed calculations, the largest electric dipole transition moment is at the equilibrium point of the electronic ground state. Thus, the Franck–Condon approximation is valid for the consideration of the electronic transition and the calculation of the photolysis cross section for the investigated molecules.
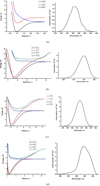 |
Fig. 2. Potential energy curves and photolysis cross sections for OH (a), LiO (b), NaO (c), and KO (d). |
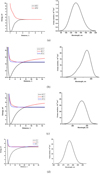 |
Fig. 3. Potential energy curves and photolysis cross sections for HCl (a), LiCl (b), NaCl (c), and KCl (d). |
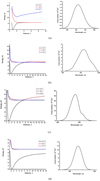 |
Fig. 4. Potential energy curves and photolysis cross sections for HF (a), LiF (b), NaF (c), and KF (d). |
3.1. Metal oxides and OH
Potential energies for the ground and several first excited electronic states calculated for the metal oxides LiO, NaO, KO, and OH hydroxide are given in Fig. 2. We note that the ground electronic states for OH, LiO, and NaO are two-fold degeneracy and have the symmetry of X2Π, and for KO – X2Σ+.
Figure 2 shows that the lowest excited electronic states for dissociation for all metal oxides (B2Σ+) and (B2Σ−) for the OH radical are unbound. We note that the excited state C2Π for metal oxides becomes bound owing to the nonadiabatic interaction between it and the ground state X2Π. The nonadiabatic interaction leads to the repulsion of these potential curves near the internuclear distances 3.7 and 4.1 Å for LiO and NaO correspondingly. Unlike the above molecules, the first excited states A2Π and C2Π of KO molecule have the same symmetry and, as a result, these electronic states are also repulsed owing to the nonadiabatic interaction at the internuclear distance near 5.9 Å. For this reason, the electronic state C2Π is bound. Thus, we have again only one excited state B2Σ−, which has to be taken into account to calculate the photolysis rate and lifetime for LiO, NaO, and KO. We also note that the transitions X2Π → B2Σ+ and X2Σ+ → B2Σ− are allowed in accordance with the selection rules (Khalil et al. 2011). However, there is a point of lowest energy of the intersection between bound A2Σ− and the unbound state B2Σ+ for OH, where nonadiabatic interaction can occur. Therefore the additional X2Σ+ → A2Σ+ channel is considered, too. In this case the absorption occurs from X2Σ+ into ν = 2 of A2Σ+, where ν is a vibrational number. The nonadiabatic interaction between A2Σ− and B2Σ+ leads to the B2Σ+ decay state. This channel slightly increases the cross section of photolysis (10%) due to the transition dipole moment of X2Σ+ → A2Σ+ being smaller than for X2Σ+ → B2Σ−. We note that there is an intersection point between A2Σ− and B2Σ− for LiO, NaO, and KO as well. However, the transition dipole moment of X2Σ+ → A2Σ+ is very small (0.05 au) and this point is located at a significantly higher energy than for the OH case. Therefore, we can neglect the X2Σ+ → A2Σ+ channel, and X2Σ+ → B2Σ− is the dominant channel.
3.2. Chlorides and fluorides of metals and HCl, HF
Potential energy curves for the ground state and some lower excited-electronic states of molecules LiCl, NaCl, KCl, LiF, NaF, KF, HCl, and HF are given in Figs. 3 and 4. The ground states of these molecules have the same symmetry X1Σ+.
It should be noted that for the molecules LiCl, NaCl, KCl, LiF, and NaF, the nonadiabatic interaction, as for the molecules considered in Sect. 3.1, is the cause of repulsion of their potential energy curves. As a result, such repulsion of the curves (B1Σ+, X1Σ+) occurs in the distances of 6.7 Å, 7.2 Å, and 7.8 Å, and 20 Å for LiCl and LiF, NaF and NaCl, and KCl, respectively. Finally, there is only one electronic decay state (A1Π) for these molecules and for HF, HCl. In contrast to molecules considered in this Section, the KF molecule has two excited decay states, A1Π and B1Σ+ (Fig. 4d), which both give a contribution to the photolysis rate. We note that there are two possible photolysis channels, X1Σ+ → A1Π and X1Σ+ → B1Σ+, for LiCl, NaCl, KCl, LiF, NaF, and KF. In the case of X1Σ+ → B1Σ+ channel for LiCl, NaCl, KCl, LiF, NaF the nonadiabatic interaction between X1Σ+ and B1Σ+ leads to the transition into X1Σ+ state in the dissociation region of R. Thus the X1Σ+ → B1Σ+ channel consists of two steps: the electronic transition from X1Σ+ to B1Σ+ and the radiationless electronic transition to X1Σ+ due to the nonadiabatic interaction. The last step is very fast because of the small energy gap between X1Σ+ and B1Σ+ at the repulsive point of R and the strong nonadiabatic interaction between them, as can be seen in Fig. 4. In order to calculate the cross section for this channel, we used the fitting parameters (A and B) for A1Π because the potential energy curve of B1Σ+ until the repulsive point, and of X1Σ+ after the repulsive point, are very similar to whole potential energy curve of A1Π. The transition dipole moment was used for X1Σ+ → B1Σ+ in this case.
We note that the photolysis channel with the emission from B1Σ+ → A1Π for HCl (it is not shown) and HF is also possible. The probability of this channel is dependent on the transition moments of X1Σ+ → B1Σ+ and B1Σ+ → A1Π. According to the XMC-QDPT2 calculation, this value is 0.000022 au for B1Σ+ → A1Π, 0.000007 au for X1Σ+ → B1Σ+ of HCl, 0.05 au for B1Σ+ → A1Π, and 0.05 au for HF. Therefore this channel gives the smallest contributions (≪10%), followed by the X1Σ+ → A1Π channel. Thus we neglect it for the estimation of the photolysis lifetime.
3.3. Cross sections
The photolysis cross sections versus the wavelength for all considered diatomic molecules are also given in Figs. 2–4. We can see that for each molecule under consideration, the maximum of the photolysis cross section occurs for wavelengths between the initial and final electronic states. The dependence of photolysis cross sections on the wavelength is caused by the dependence of ε = E − Eif on the wavelength.
3.4. Photolysis lifetimes
The photolysis lifetimes (τ) and photolysis rates (J) were calculated in the framework of the analytical model considered above in Sect. 2.1. According to the analytical model used, the accuracy of obtained photolysis lifetimes depends on the errors of calculation of dipole moments for electronic transitions, characteristics of photolysis cross sections, and dissociation limits. In Table A.1 the dissociation limits and photolysis lifetimes are given together with experimental lifetimes.
As can be seen from Table A.1, the calculated values of dissociation energies for molecules OH, LiO, KO, HCl, LiCl, NaCl, KCl, HF, LiF, and NaF are in good agreement with the experimental data (the discrepancies are ∼4%). For NaO, the deviation between experimental and theoretical values is about 10% and for KF – 20%. We note that our calculated values for the dissociation energy for KO, LiF, and NaF are in a good agreement with theoretical values of Vasiliu et al. (2010) (the discrepancies are about 3%). In contrast, the deviation is increased to 6% for LiO and to 10% for NaO and NaCl, and up to 18% for KF. In addition, Table A.1 shows that for LiO, KO, LiF, and NaF molecules the values of the dissociation energy agree better with the experimental values in comparison with the theoretical values of other authors (Vasiliu et al. 2010). However, the dissociation energies calculated in this work are underestimated by 1% for LiCl, 7% for NaCl, and 9% for NaO, and overestimated by 16.8% for KF being compared with other theoretical works. Such a large difference is explained by the use (Vasiliu et al. 2010) of the higher basis aug-cc-pwCV5Z for calculation of potential energy curves.
Nevertheless, the theoretical values for photolysis lifetimes for OH, HCl, LiCl, NaCl, and HF agree with the experimental values within factor of 1.5–2, while for KCl and NaO within a factor of 3 (see Table A.1). For example, the maximal measured photolysis sections for LiCl, NaCl, and KCl are 9 × 10⁻¹⁸, 3.5 × 10⁻¹⁷, and 2 × 10⁻¹⁷ cm−2, respectively (Davidovits & Brodhead 1967), while the theoretical photolysis cross sections for these species are lower (see Table A.1). One of the reasons for such discrepancies may be caused by different temperature conditions because our calculations were carried out at 0°K, while the measurements of the LiCl, NaCl, and KCl photolysis cross sections (Davidovits & Brodhead 1967) along with the NaO photolysis cross section (Self & Plane 2002) were performed at 1100 ± 25 and 200 K, respectively. Our calculated photolysis lifetimes of LiF, NaF, and KF are 24, 3, and 60 times longer, respectively, than the photolysis lifetimes estimated by Schaefer & Fegley (2005) based on trends of photolysis rates and bond energies for the chlorides, bromides, and iodides. However, the estimation of the photolysis lifetime for LiF, NaF, and KF was carried out assuming that their unknown σ(λ) are almost identical to the known σ(λ) of LiCl, NaCl, and KCl. According to Table A.1, this approximation is not valid because the values of σ(λ) are noticeable different for these compounds. Therefore our computed photolysis lifetimes for LiF, NaF, and KF are likely to be adequate and predictive.
According to Table A.1, the photolysis lifetimes of LiO, NaO, KO, LiCl, NaCl, and KCl molecules are less than the typical time of the first ballistic flight in the exospheres of the main atmosphereless bodies of the solar system (Mercury, the Moon, Io, and Europa), which is ∼103 s. Therefore, these molecules are already dissociated into separate atoms during the first ballistic flight. For other considered molecules, the photolysis lifetimes are comparable or longer than the typical time of a ballistic flight. It means that just a small fraction of these molecules can be destroyed by solar photons during the first ballistic flight in the exospheres of the main atmosphereless bodies of the solar system. Hence, fluorides are minor sources of alkali atoms in planetary exospheres in comparison with oxides and chlorides not only because of the low abundance of fluorine in the solar system, but also because of long photolysis lifetimes of fluorides of alkali metals.
The agreement of the obtained dependence of the photolysis rate on wavelength with other works is more or less reasonable (see Table A.2 and Fig. 5). For the case of OH photolysis we predict a broad maximum of the photolysis rate at 175–220 nm, while experimental studies (Huebner et al. 1992) and the theoretical work of van Dishoeck & Dalgarno (1983) of the photolysis reaction OH + photon = O(3P)+H show a narrower peak at 170–180 nm and two very narrow peaks near 250 nm. Our theoretical results predict the maximal HF photolysis rate at 121.6 nm. The same maximum is observed in the laboratory (Huebner et al. 1992). We predict higher HF photolysis rates at 130–140 nm than at 100–110 nm in agreement with laboratory data (Huebner et al. 1992). The presence of a narrow and strong Lyman alpha peak at 121.6 nm and the position of calculated broad maximum of HCl photolysis rate (170–210 nm) are in agreement with laboratory data (Huebner et al. 1992). Our values of the maximal photolysis cross section of HCl and the position of the maximal photolysis cross-section peak are comparable to previous theoretical studies of Alexander et al. (1993) (see Table A.1). Our obtained value of the HF maximal photolysis cross section (1.6 × 10⁻¹⁸ cm−2) is two times smaller than that of previous theoretical calculations (3.2 × 10⁻¹⁸ cm−2; Brown & Balint-Kurti 2000), while the obtained position of the photolysis peak is shifted by about 5% to shorter wavelengths in comparison with Brown & Balint-Kurti (2000). The maximal measured photolysis cross sections of LiCl, NaCl, and KCl is 235, 240, and 250 nm (Davidovits & Brodhead 1967), respectively, while the maximal theoretical photolysis cross sections are shifted to longer wavelengths (see Table A.1), leading to lower velocities of photolysis-generated alkali metal atoms. Thus, our approach allows for estimating the properties of the main photolysis peaks of diatomic molecules qualitatively and, respectively, the velocities of photolysis-generated atoms.
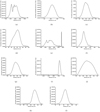 |
Fig. 5. Velocity distribution of atoms of alkali metals and hydrogen produced during photolysis of corresponding diatomic molecules: (a) OH; (b) LiO; (c) NaO; (d) KO; (e) HCl; (f) LiCl; (g) NaCl; (h) KCl; (i) HF; (j) LiF; (k) NaF; and (l) KF. |
3.5. Velocities of photolysis-generated atoms of alkali metals and hydrogen
Comparing the velocity distribution of photolysis-generated atoms of alkali metals and hydrogen (see Fig. 5) with escape velocities from atmosphereless bodies of the solar system (Europa – 2025 m s−1, the Moon – 2380 m s−1, Io – 2558 m s−1, and Mercury – 4250 m s−1), we can conclude that photolysis-generated hydrogen atoms escape the gravitational field of the considered bodies upon photolysis of OH, HCl, and HF. A significant part of photolysis-generated Li atoms forms after LiO, LiCl, and LiF photolysis is able to escape Europa, the Moon, and Io, while Mercury captures the majority of such Li atoms. Only a minor fraction of photolysis-generated Na and K atoms is able to escape from the Moon, Io, and Europa upon photolysis of corresponding oxides, chlorides, and fluorides. The presence of photolysis-generated metal atoms in planetary exospheres can be confirmed by an analysis of the velocity distribution of exospheric metal atoms (see more detailed discussion of this question in Valiev et al. 2017).
4. Summary
A perspective ab initio approach to calculation of the photolysis cross sections of diatomic molecules has been developed. The accuracy of this approach was estimated by comparison with available experimental and theoretical studies of the photolysis of selected diatomic molecules. The developed approach can be used for the calculation of photolysis cross sections and photolysis lifetimes of other diatomic molecules, especially those which are very difficult to study under laboratory conditions.
Acknowledgments
A.A.B. was supported by RFBR grant No. 18-03-00726. C.W. was supported by the Deutsche Forschungsgemeinschaft (DFG, German Research Foundation) RFBR-DFG grant No. WO 1800/7-1. R.R.V. was supported by TU Dortmund University. R.R. Valiev and T. Kurten thank Svenska Kulturfonden, grant number 136102 and Academy of Finland, grant number 1315600. R.V. is personally thankful to the Tomsk Polytechnic University Competitiveness Enhancement Program (VIU-RSCABS-142/2019).
References
- Acharyya, K., & Herbst, E. 2017, ApJ, 850, 105 [NASA ADS] [CrossRef] [Google Scholar]
- Agúndez, M., Fonfría, J. P., Cernicharo, J., et al. 2012, A&A, 543, A48 [NASA ADS] [CrossRef] [EDP Sciences] [Google Scholar]
- Alexander, M. H., Pouilly, B., & Duhoo, T. 1993, J. Chem. Phys., 99, 1752 [NASA ADS] [CrossRef] [Google Scholar]
- Barton, E. J., Chiu, C., Golpayegani, S., et al. 2014, MNRAS, 442, 1821 [NASA ADS] [CrossRef] [Google Scholar]
- Baryshnikov, G. V., Valiev, R. R., Karaush, N. N., Minaev, B. F., & Agren, H. 2015, Chem. Phys., 459, 65 [CrossRef] [Google Scholar]
- Baryshnikov, G. V., Valiev, R. R., Karaush, N. N., et al. 2016, Phys. Chem. Chem. Phys., 18, 28040 [CrossRef] [Google Scholar]
- Berezhnoy, A. A., & Klumov, B. A. 2008, Icarus, 195, 511 [NASA ADS] [CrossRef] [Google Scholar]
- Berezhnoy, A. A. 2010, Adv. Space Rev., 45, 70 [NASA ADS] [CrossRef] [Google Scholar]
- Berezhnoy, A. A. 2013, Icarus, 226, 205 [NASA ADS] [CrossRef] [Google Scholar]
- Berezhnoy, A. A. 2018, Icarus, 300, 200 [NASA ADS] [CrossRef] [Google Scholar]
- Bida, Th. A., & Killen, R. M. 2017, Icarus, 289, 227 [NASA ADS] [CrossRef] [Google Scholar]
- Bittner, D. M., & Bernath, P. F. 2018, ApJS, 235, 8 [NASA ADS] [CrossRef] [Google Scholar]
- Brems, V. 1998, Chem. Phys., 238, 85 [CrossRef] [Google Scholar]
- Brown, M. E., & Hill, R. E. 1996, Nature, 380, 229 [NASA ADS] [CrossRef] [Google Scholar]
- Brown, A., & Balint-Kurti, R. E. 2000, J. Chem. Phys., 113, 1870 [NASA ADS] [CrossRef] [Google Scholar]
- Bulewicz, E. M., Phillips, L. E., & Sugden, T. M. 1961, Trans. Faraday Soc., 57, 921 [CrossRef] [Google Scholar]
- Cassidy, T. A., Merkel, A. W., Burger, M. H., et al. 2015, Icarus, 248, 547 [NASA ADS] [CrossRef] [Google Scholar]
- Colaprete, A. 2016, Science, 351, 249 [NASA ADS] [CrossRef] [Google Scholar]
- Davidovits, P., & Brodhead, D. C. 1967, J. Chem. Phys., 46, 2968 [NASA ADS] [CrossRef] [Google Scholar]
- De Keyser, J., Dhooghe, F., Altwegg, K., et al. 2017, MNRAS, 469, S695 [CrossRef] [Google Scholar]
- Dhooghe, F., De Keyser, J., Altwegg, K., et al. 2017, MNRAS, 472, 1336 [NASA ADS] [CrossRef] [Google Scholar]
- Duhoo, T., & Pouilly, B. 1995, J. Chem. Phys., 103, 182 [NASA ADS] [CrossRef] [Google Scholar]
- Engin, S., Sisourat, N., & Carniato, S. 2012, J. Chem. Phys., 137, 154304 [NASA ADS] [CrossRef] [Google Scholar]
- Evans, L. G., Peplowski, P. N., McCubbin, F. M., et al. 2015, Icarus, 257, 417 [NASA ADS] [CrossRef] [Google Scholar]
- Granovsky, A. A. 2011, J. Chem. Phys., 134, 214113 [NASA ADS] [CrossRef] [Google Scholar]
- Granovsky, A. A. 2012, Firefly, vol 8.0.0, http://classic.chem.msu. su/gran/firefly/index.html [Google Scholar]
- Grava, C., Schneider, N. M., Leblanc, F., et al. 2014, J. Geophys. Res. Planets, 119, 404 [NASA ADS] [CrossRef] [Google Scholar]
- Grumpe, A., Wöhler, C., Berezhnoy, A. A., & Shevchenko, V. V. 2019, Icarus, 321, 486 [NASA ADS] [CrossRef] [Google Scholar]
- Heays, A. N., Bosman, A. D., & van Dishoeck, E. F. 2017, A&A, 602, A105 [NASA ADS] [CrossRef] [EDP Sciences] [Google Scholar]
- Herzberg, G. 1989, Molecular Spectra and Molecular Structure: Spectra of Diatomic Molecules (Malabar, USA: Krieger Pub Co.), 660 [Google Scholar]
- Huber, K. P., & Herzberg, G. 1979, Molecular Spectra and Molecular Structure. IV. Constants of Diatomic Molecules (New York: Van Nostrand Reinhold Co.), 716 [Google Scholar]
- Huebner, W. F., Keady, J. J., & Lyon, S. P. 1992, Astrophys. Space Sci., 195, 291 [Google Scholar]
- Huebner, W. F., & Mukherjee, J. 2015, Planet. Space Sci., 106, 11 [Google Scholar]
- Hynes, A. J., Steinberg, M., & Schofield, K. J. 1984, Chem. Phys., 80, 2585 [NASA ADS] [Google Scholar]
- Indriolo, N., Neufeld, D. A., Seifahrt, A., & Richter, M. J. 2013, ApJ, 764, 188 [NASA ADS] [CrossRef] [Google Scholar]
- Johns, J. W. C., & Barrow, R. F. 1959, Proc. R. Soc. London Ser. A, 251, 504 [NASA ADS] [CrossRef] [Google Scholar]
- Khalil, H., Brites, V., Quéré, F. L., & Léonard, C. 2011, Chem. Phys., 386, 50 [CrossRef] [Google Scholar]
- Lambert, H. M., Dagdigian, P. J., & Alexander, M. H. 1998, J. Chem. Phys., 108, 4460 [NASA ADS] [CrossRef] [Google Scholar]
- Langhoff, S. R., Bauschlicher, C. W., & Partridge, H. 1986, J. Chem. Phys., 84, 4474 [NASA ADS] [CrossRef] [Google Scholar]
- Langhoff, S. R., Partridge, H., & Bauschlicher, Ch. W. 1991, Chem. Phys., 153, 1 [NASA ADS] [CrossRef] [Google Scholar]
- Lee, S. 1995, J. Chem. Phys., 103, 3501 [NASA ADS] [CrossRef] [Google Scholar]
- Li, Y.-J., Zhang, P.-Y., & Han, K.-L. 2010, J. At. Mol. Sci., 1, l8 [Google Scholar]
- Litvak, M. L., & Sanin, A. B. 2018, Physics-Uspekhi, 61, 779 [NASA ADS] [CrossRef] [Google Scholar]
- Lodders, K. 1999, ApJ, 519, 793 [NASA ADS] [CrossRef] [Google Scholar]
- Mapple 14 2010, (Waterloo Maple Inc.), https://www.maplesoft.com [Google Scholar]
- Mbarek, R., & Kempton, E. M.-R. 2016, ApJ, 827, 121 [NASA ADS] [CrossRef] [Google Scholar]
- Minaev, B. F. 2007, Russ. Chem. Rev., 76, 1059 [NASA ADS] [CrossRef] [Google Scholar]
- Minaev, B. F., Valiev, R. R., Nikonova, E. N., et al. 2015, J. Phys. Chem. A, 119, 1948 [CrossRef] [Google Scholar]
- Mendillo, M., Laurent, S., Wilson, J., et al. 2007, Nature, 448, 330 [NASA ADS] [CrossRef] [Google Scholar]
- Monje, R. R., Lis, D. C., Roueff, E., et al. 2013, ApJ, 767, 81 [NASA ADS] [CrossRef] [Google Scholar]
- Moses, J. I., Zolotov, M. Yu., & Fegley, Jr., Br. 2002, Icarus, 156, 107 [NASA ADS] [CrossRef] [Google Scholar]
- Moullet, A., Lellouch, E., Moreno, R., et al. 2013, ApJ, 776, 32 [NASA ADS] [CrossRef] [Google Scholar]
- Nee, J. B., Suto, M., & Lee, L. C. 1985, J. Phys. B: At. Mol. Phys., 18, L293 [CrossRef] [Google Scholar]
- Regan, P. M., Ascenzi, D., Brown, A., Balint-Kurti, G. G., & Orr-Ewing, A. J. 2000, J. Chem. Phys., 112, 10259 [NASA ADS] [CrossRef] [Google Scholar]
- Renggli, C. J., King, P. L., Henley, R. W., & Norman, M. D. 2017, Geochim. Cosmochim. Acta, 206, 296 [NASA ADS] [CrossRef] [Google Scholar]
- Riess, I. 1972, J. Chem. Phys., 56, 1613 [NASA ADS] [CrossRef] [Google Scholar]
- Sandor, B. J., & Clancy, R. T. 2012, Icarus, 220, 618 [NASA ADS] [CrossRef] [Google Scholar]
- Schaefer, L., & Fegley, Jr., Br. 2005, Icarus, 173, 454 [NASA ADS] [CrossRef] [Google Scholar]
- Self, D. E., & Plane, J. M. C. 2002, Phys. Chem. Chem. Phys., 4, 16 [CrossRef] [Google Scholar]
- Silver, J. A., Worsnop, D. R., Freedman, A., & Kolb, C. E. 1986, J. Chem. Phys., 84, 4378 [NASA ADS] [CrossRef] [Google Scholar]
- Steinberg, M., & Schofield, K. 1991, J. Chem. Phys., 94, 3901 [NASA ADS] [CrossRef] [Google Scholar]
- van Dishoeck, E. F., & Dalgarno, A. 1983, J. Chem. Phys., 79, 873 [NASA ADS] [CrossRef] [Google Scholar]
- van Dishoeck, E. F., van Hemert, M. C., & Dalgarno, A. 1982, J. Chem. Phys., 77, 3693 [NASA ADS] [CrossRef] [Google Scholar]
- van Dishoeck, E. F., van Hemert, M. C., Allison, A., & Dalgarno, A. 1984, J. Chem. Phys., 81, 5709 [NASA ADS] [CrossRef] [Google Scholar]
- Valiev, R. R., & Minaev, B. F. 2016, J. Mol. Model., 22, 214 [CrossRef] [Google Scholar]
- Valiev, R. R., Telminov, E. N., Solodova, T. A., et al. 2013, Chem. Phys. Lett., 588, 184 [NASA ADS] [CrossRef] [Google Scholar]
- Valiev, R. R., Telminov, E. N., Solodova, T. A., et al. 2014, Spectrochim. Acta A, 128, 137 [NASA ADS] [CrossRef] [Google Scholar]
- Valiev, R. R., Berezhnoy, A. A., Minaev, B. F., Chernov, V. E., & Cherepanov, V. N. 2016, Russ. Phys. J., 59, 536 [CrossRef] [Google Scholar]
- Valiev, R. R., Berezhnoy, A. A., Sidorenko, A. D., Merzlikin, B. S., & Cherepanov, V. N. 2017, Planet. Space Sci., 145, 38 [NASA ADS] [CrossRef] [Google Scholar]
- Vasiliu, M., Li, S., Peterson, K. A., Feller, D., Gole, J. L., & Dixon, D. A. 2010, J. Phys. Chem. A, 114, 4272 [CrossRef] [Google Scholar]
- Vedeneyev, V. I., Gurvich, L. V., Kondratyev, V. N., Medvedev, V. A., & Frankevich, Ye. L. 1966, Bond Energies, Ionization Potentials, and Electron Affinities (New York: St. Martin’s Press), 202 [Google Scholar]
- Wan, M.-J., Huang, D.-H., Yang, J.-S., et al. 2015, Mol. Phys., 113, 1359 [NASA ADS] [CrossRef] [Google Scholar]
Appendix A: Tables
Dipole moment of transition, dissociation energy, cross section, and photolysis lifetime of diatomic molecules.
Properties of photolysis of studied diatomic molecules for quiet Sun.
All Tables
Dipole moment of transition, dissociation energy, cross section, and photolysis lifetime of diatomic molecules.
All Figures
|
Fig. 1. Photodissociation of diatomic molecules in the unbound excited state. |
| In the text | |
|
Fig. 2. Potential energy curves and photolysis cross sections for OH (a), LiO (b), NaO (c), and KO (d). |
| In the text | |
|
Fig. 3. Potential energy curves and photolysis cross sections for HCl (a), LiCl (b), NaCl (c), and KCl (d). |
| In the text | |
|
Fig. 4. Potential energy curves and photolysis cross sections for HF (a), LiF (b), NaF (c), and KF (d). |
| In the text | |
|
Fig. 5. Velocity distribution of atoms of alkali metals and hydrogen produced during photolysis of corresponding diatomic molecules: (a) OH; (b) LiO; (c) NaO; (d) KO; (e) HCl; (f) LiCl; (g) NaCl; (h) KCl; (i) HF; (j) LiF; (k) NaF; and (l) KF. |
| In the text | |
Current usage metrics show cumulative count of Article Views (full-text article views including HTML views, PDF and ePub downloads, according to the available data) and Abstracts Views on Vision4Press platform.
Data correspond to usage on the plateform after 2015. The current usage metrics is available 48-96 hours after online publication and is updated daily on week days.
Initial download of the metrics may take a while.