Fig. 6.
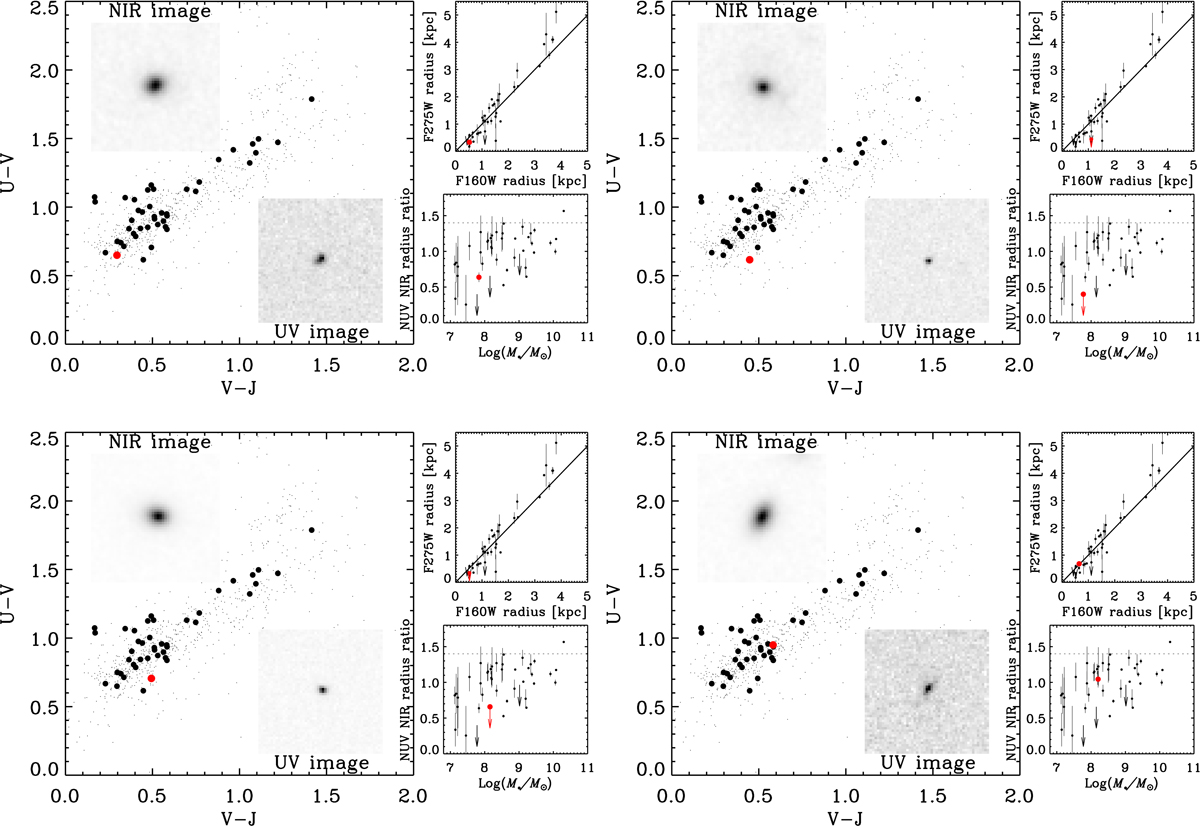
Examples of low-mass galaxies. The two stamp images in each panel are the F160W and F275W images. The red dots indicate the location of the example galaxy in UVJ diagram, F275W /F160W radius diagram, and the stellar mass vs. the F275W /F160W radius ratio map. The small black dots are the targets with zspec < 0.5 in CANDELS catalogue. We can see a very compact UV core in the galaxy centre, leading to a small star-formation region.
Current usage metrics show cumulative count of Article Views (full-text article views including HTML views, PDF and ePub downloads, according to the available data) and Abstracts Views on Vision4Press platform.
Data correspond to usage on the plateform after 2015. The current usage metrics is available 48-96 hours after online publication and is updated daily on week days.
Initial download of the metrics may take a while.