Fig. 4.
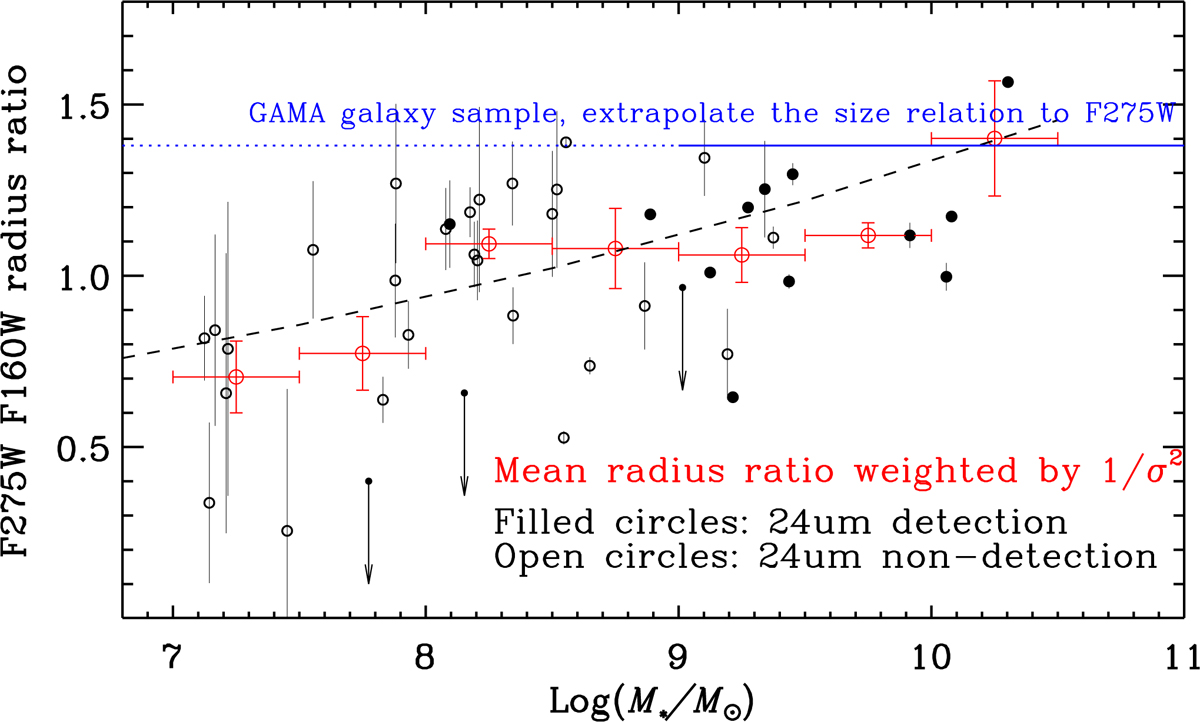
F275W, F160W radius ratio and stellar mass for our sample. Few galaxies have a high F275W to F160W radius ratio for the galaxy with the stellar mass lower than 108 M⊙. The filled circles are the targets with 24 μm detection, and the open circles are the targets that could not be detected in the 24 μm image. The blue line shows the F275W to F160W size ratio that extrapolate from the results of the GAMA galaxy sample (Kelvin et al. 2012). To better characterise the trend of the radius ratio as a function of the stellar mass, we liner fit the log(RF275W/RF160W) and the stellar mass and show the result with the dash line. To show the radius ratio transition trend along the stellar mass, we also show the mean radius ratio (weighted by 1/σ2) in each 0.5 dex stellar mass bins with red open circles, and their error bars show the standard deviation of the mean.
Current usage metrics show cumulative count of Article Views (full-text article views including HTML views, PDF and ePub downloads, according to the available data) and Abstracts Views on Vision4Press platform.
Data correspond to usage on the plateform after 2015. The current usage metrics is available 48-96 hours after online publication and is updated daily on week days.
Initial download of the metrics may take a while.