Fig. 9.
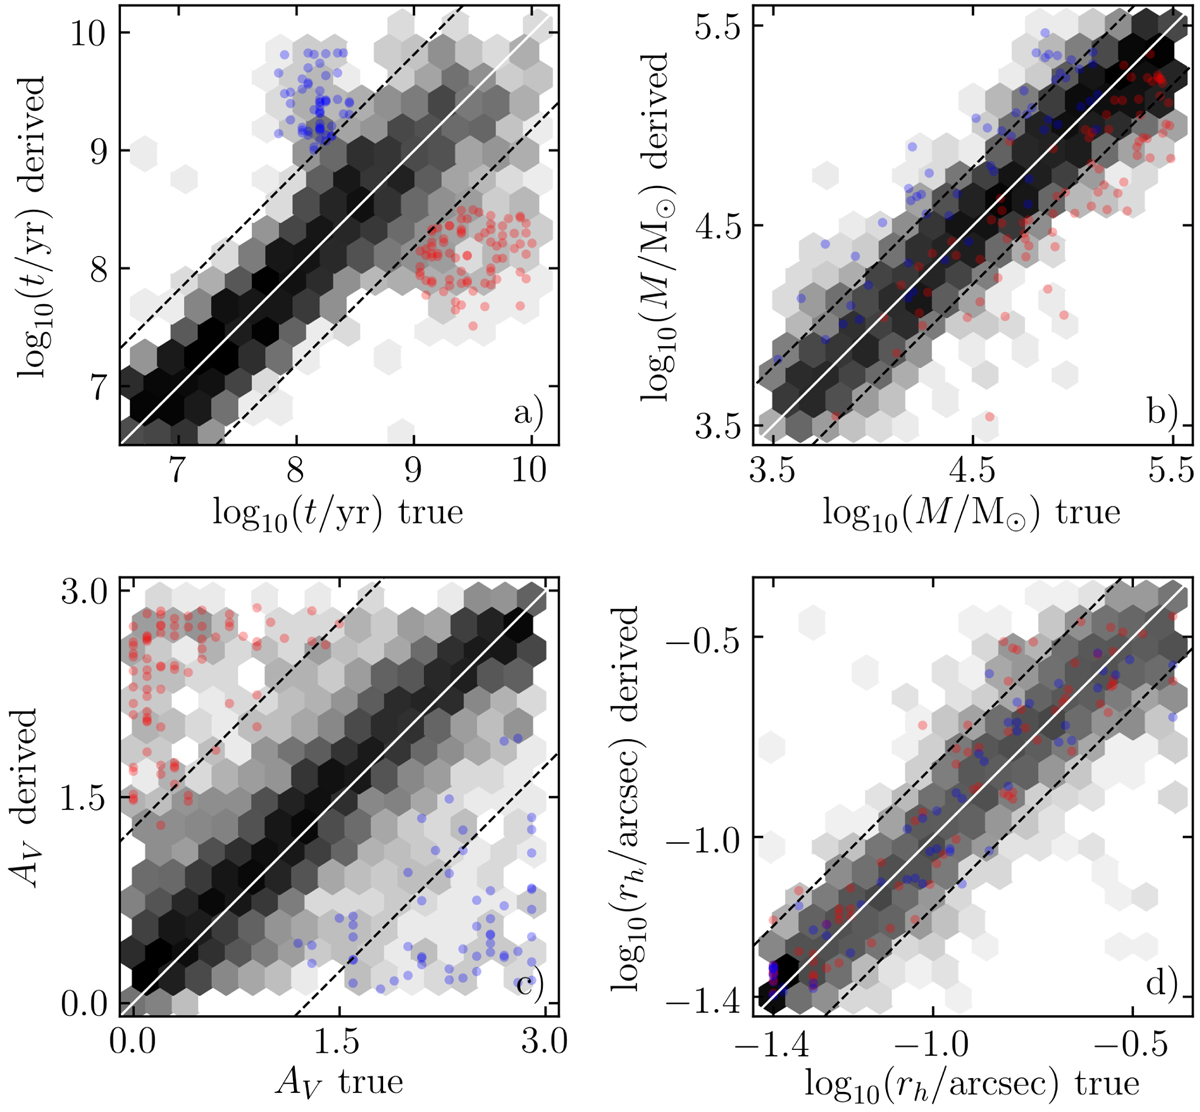
True and derived parameter values of test mock clusters visualized as a hexagonal density map. The bins are scaled logarithmically. Panels show comparisons for (a) age, (b) mass, (c) AV, and (d) rh. The dashed lines highlight the area containing 95% of the clusters. The red dots represent the clusters that were misclassified as younger than the real age values, while the blue dots represent clusters misclassified as older.
Current usage metrics show cumulative count of Article Views (full-text article views including HTML views, PDF and ePub downloads, according to the available data) and Abstracts Views on Vision4Press platform.
Data correspond to usage on the plateform after 2015. The current usage metrics is available 48-96 hours after online publication and is updated daily on week days.
Initial download of the metrics may take a while.