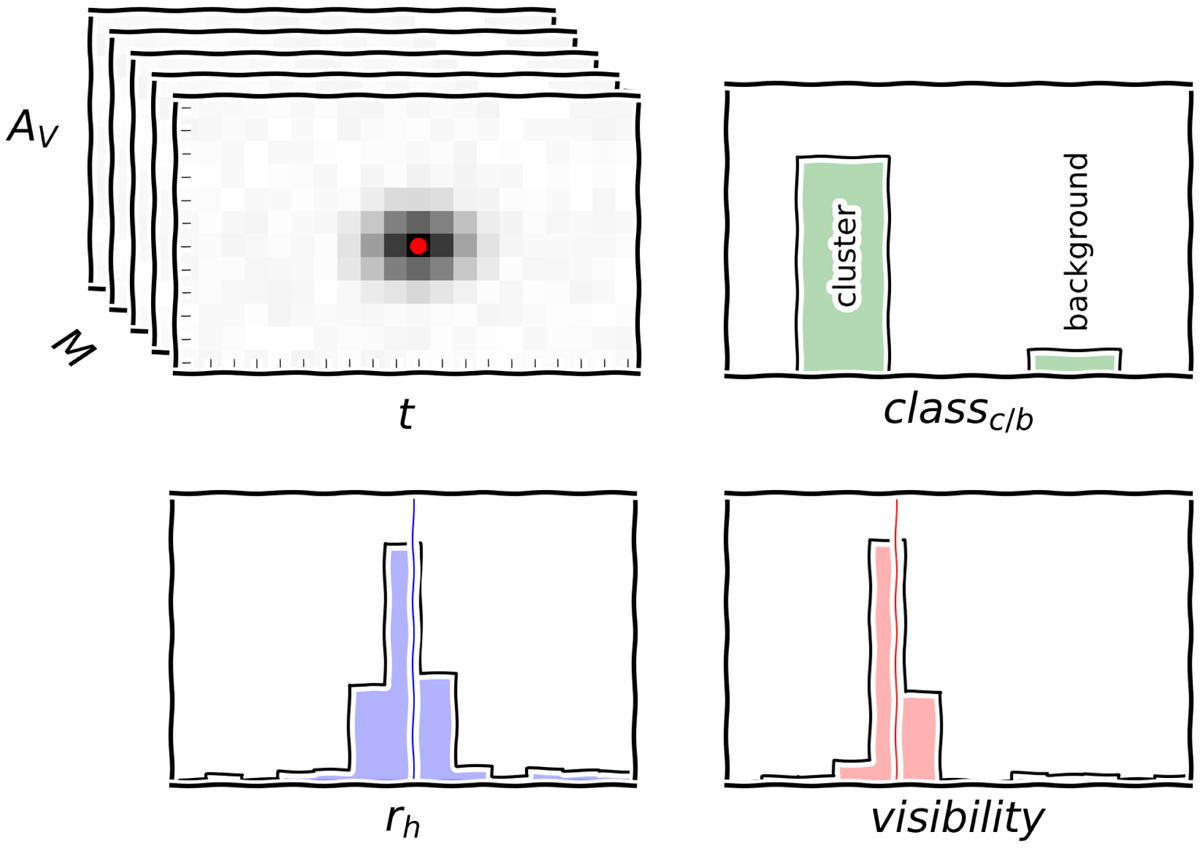
Fig. 6.

Illustration of the activations in the output layers of the CNN. While training the CNN, target activation values are provided as a 3D Gaussian distribution for age, extinction, and mass (centered on true values as denoted by the red dot) and as 1D Gaussian distributions for rh (the blue line) and visibility (the red line). classc/b is represented as a value of 0 or 1. During inference the network produces similar outputs, examples of which are depicted in Figs. 8 and 20.
Current usage metrics show cumulative count of Article Views (full-text article views including HTML views, PDF and ePub downloads, according to the available data) and Abstracts Views on Vision4Press platform.
Data correspond to usage on the plateform after 2015. The current usage metrics is available 48-96 hours after online publication and is updated daily on week days.
Initial download of the metrics may take a while.


