Fig. 5.
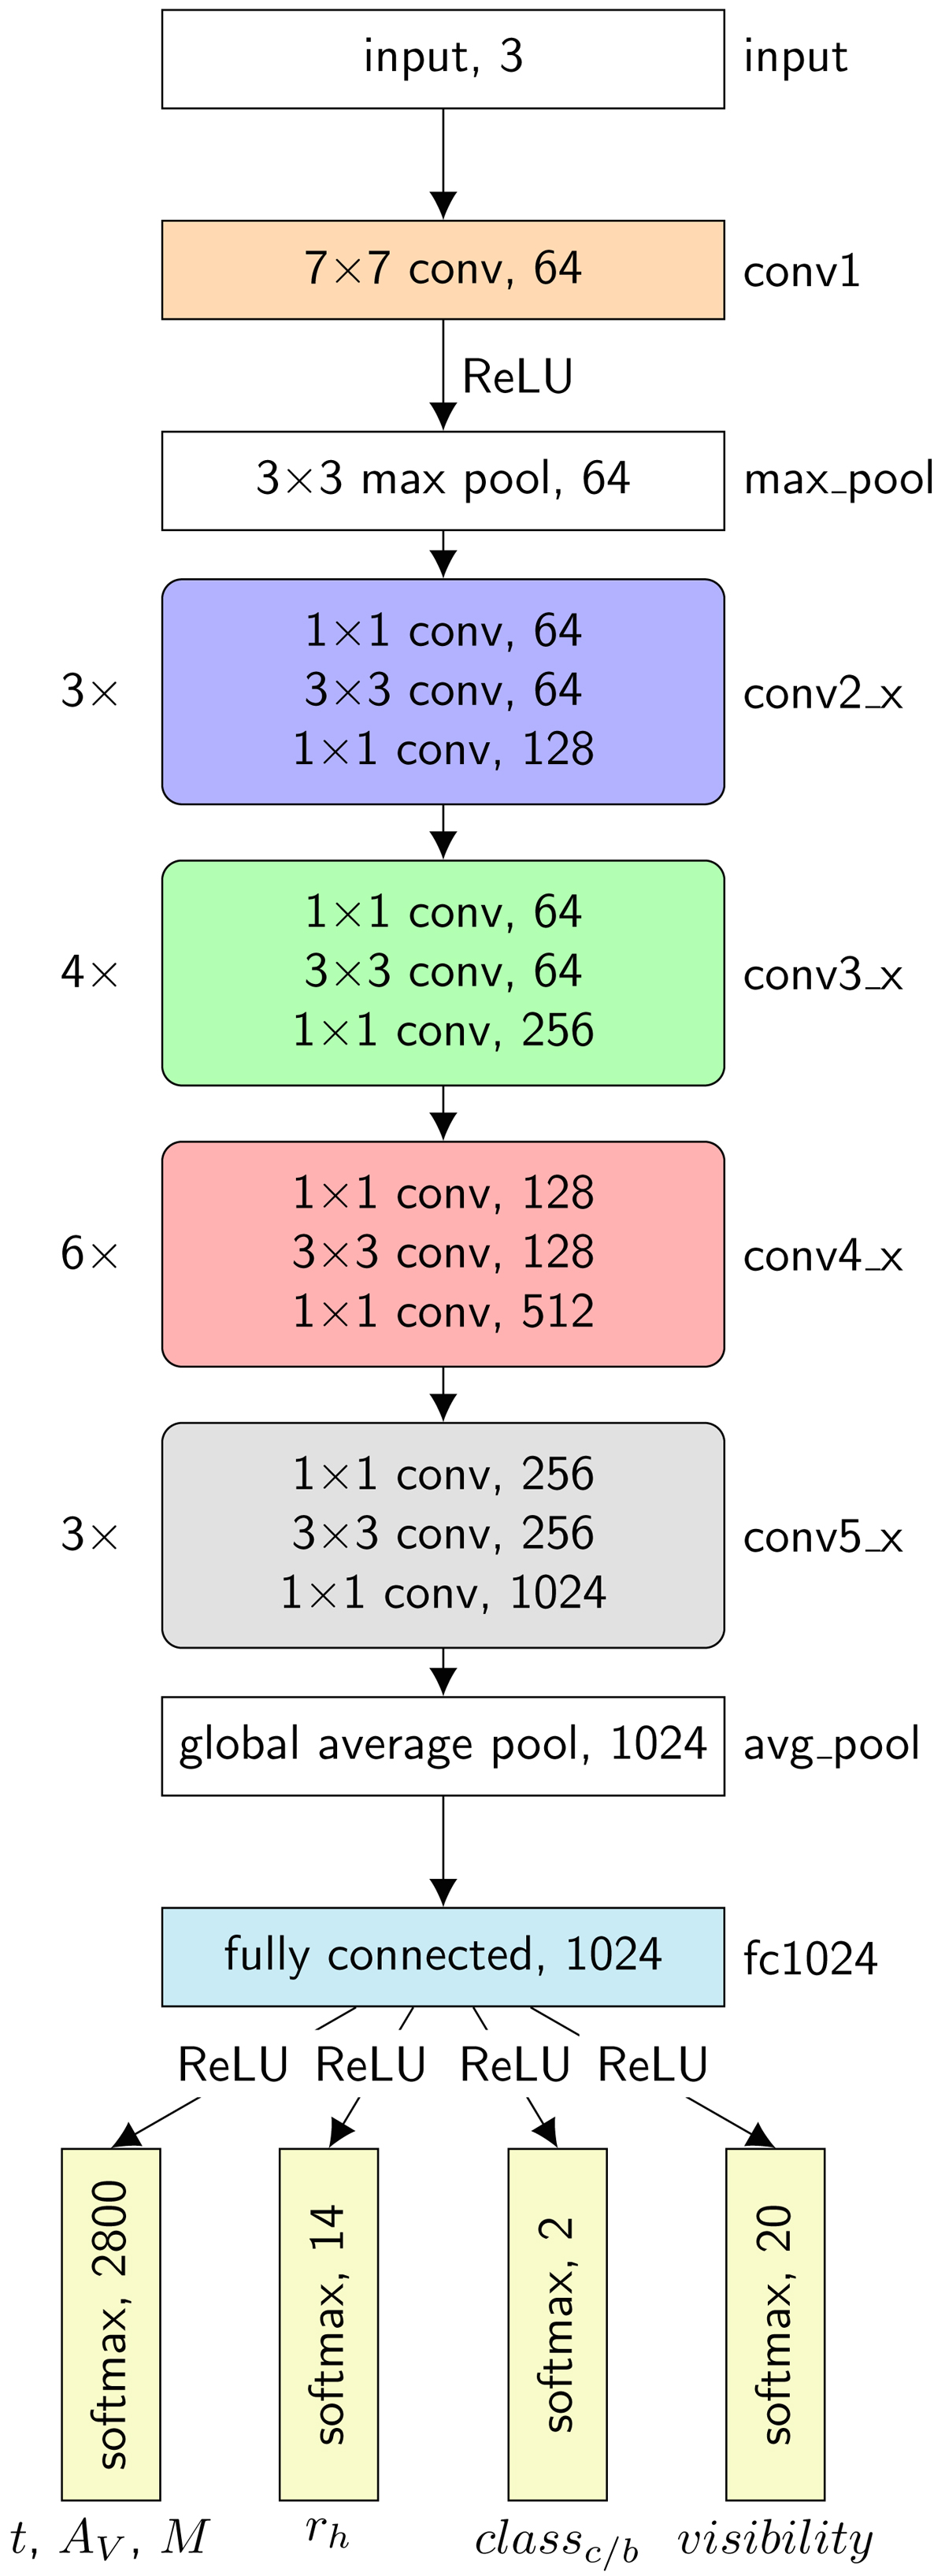
Block diagram of the CNN. The three-channel input image of a cluster passes through the network top to bottom; the output result are age, extinction, mass, size, the cluster-background class classc/b, and visibility. All blocks with sharp corners depict single layers, while blocks with rounded corners are groupings of layers. The number on the left indicates how many times the group is repeated sequentially and the name on the right corresponds to the layer names in Table 1. The blocks with non-white backgrounds are parts of the network with optimizable parameters. The last number in each row is the number of output channels from that layer. “ReLU” indicates the locations in the network where rectified linear activations are applied between blocks.
Current usage metrics show cumulative count of Article Views (full-text article views including HTML views, PDF and ePub downloads, according to the available data) and Abstracts Views on Vision4Press platform.
Data correspond to usage on the plateform after 2015. The current usage metrics is available 48-96 hours after online publication and is updated daily on week days.
Initial download of the metrics may take a while.