Fig. 3.
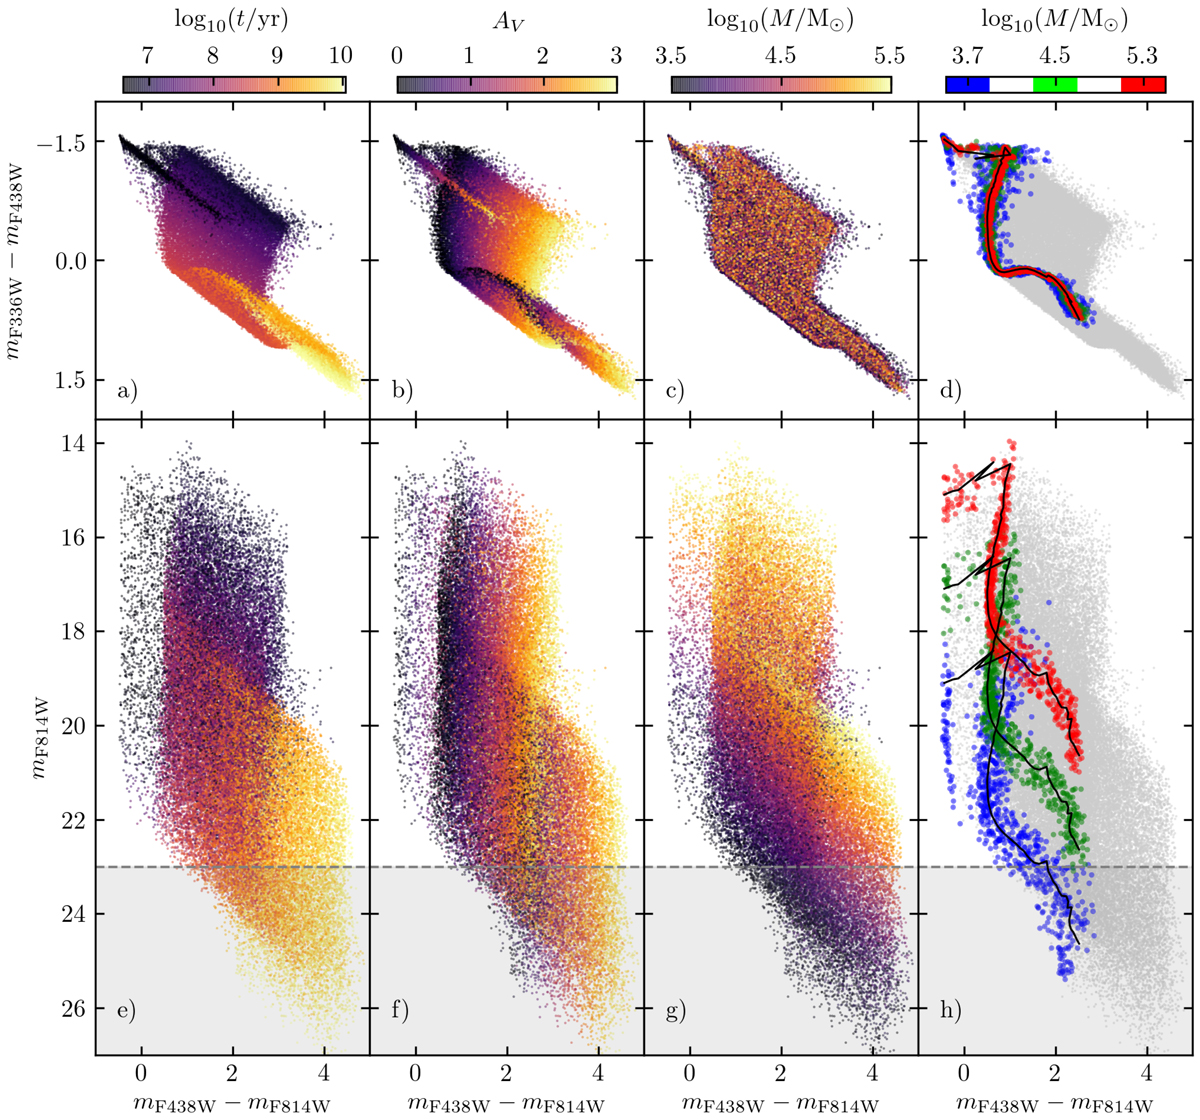
Integrated color-color and color-magnitude diagrams of 50 000 generated mock clusters of the training bank and ∼7000 faint clusters. The color coding represents different ages (a, e), extinctions (b, f), and masses (c, g). Their values are as noted on the color bars on top. The last column (d, h) shows distributions of AV < 0.2 mag star clusters filtered by three mass ranges as specified on the color bar on top. The SSP tracks centered on the specified masses are shown as black curves. The shaded area below the dashed line represents the F814W magnitude limit used to filter out faint clusters.
Current usage metrics show cumulative count of Article Views (full-text article views including HTML views, PDF and ePub downloads, according to the available data) and Abstracts Views on Vision4Press platform.
Data correspond to usage on the plateform after 2015. The current usage metrics is available 48-96 hours after online publication and is updated daily on week days.
Initial download of the metrics may take a while.