Fig. 17.
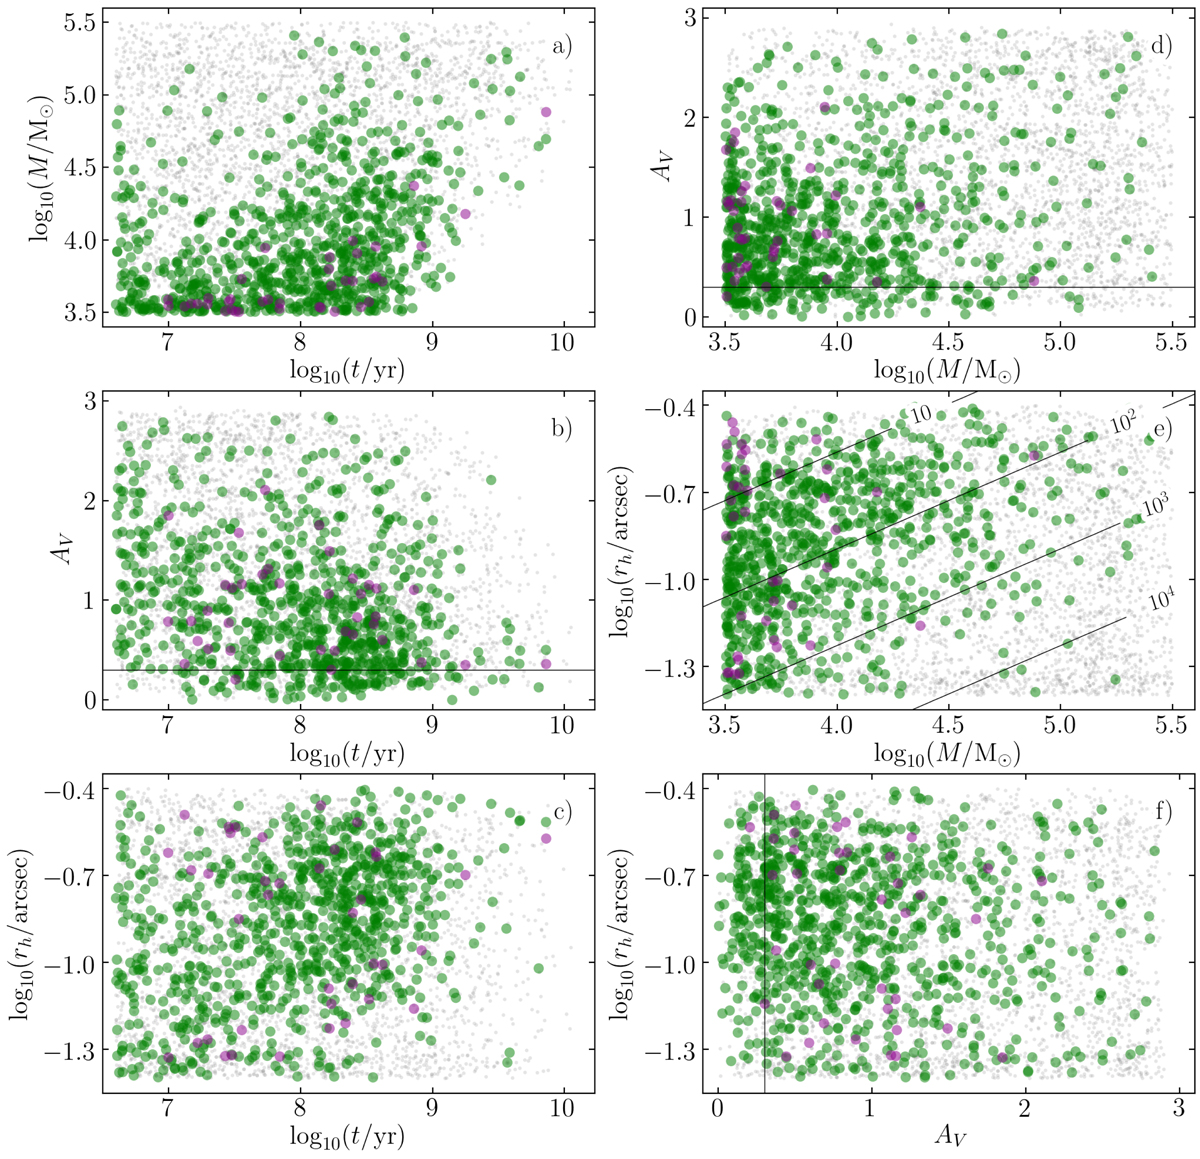
Same as Fig. 12, but for objects from Bastian et al. (2011), with values derived by CNN. The green circles represent objects classified as likely clusters, while magenta circles represent likely non-clusters, as in Fig. 15. For reference, the derived parameters of the mock cluster set are shown as faint gray points. Panel e: locations of clusters with the same density, varying from 10 to 104 M⊙/pc−3. In panels b, d, and f the solid black lines represent the amount of Galactic extinction in the direction of M 83 (AV = 0.3 mag).
Current usage metrics show cumulative count of Article Views (full-text article views including HTML views, PDF and ePub downloads, according to the available data) and Abstracts Views on Vision4Press platform.
Data correspond to usage on the plateform after 2015. The current usage metrics is available 48-96 hours after online publication and is updated daily on week days.
Initial download of the metrics may take a while.