Free Access
Fig. 16.
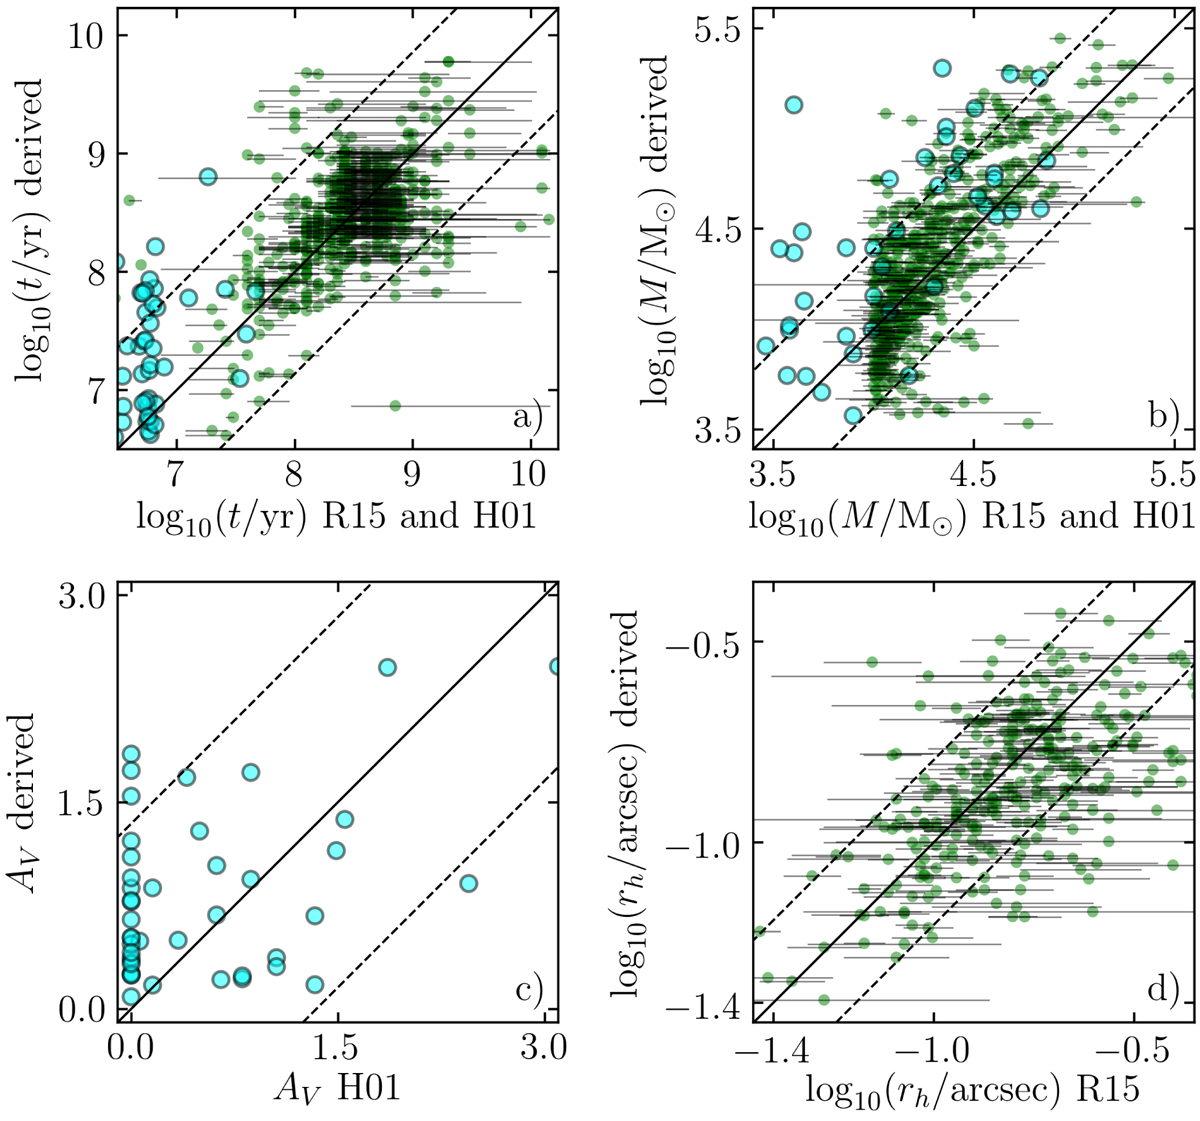
Same as Fig. 15, but with green dots representing objects from Ryon et al. (2015) and cyan dots representing objects from Harris et al. (2001). The horizontal bars denote minimum and maximum parameter values for age and mass, and statistical errors for size, as provided in the catalogs.
Current usage metrics show cumulative count of Article Views (full-text article views including HTML views, PDF and ePub downloads, according to the available data) and Abstracts Views on Vision4Press platform.
Data correspond to usage on the plateform after 2015. The current usage metrics is available 48-96 hours after online publication and is updated daily on week days.
Initial download of the metrics may take a while.