Fig. 14.
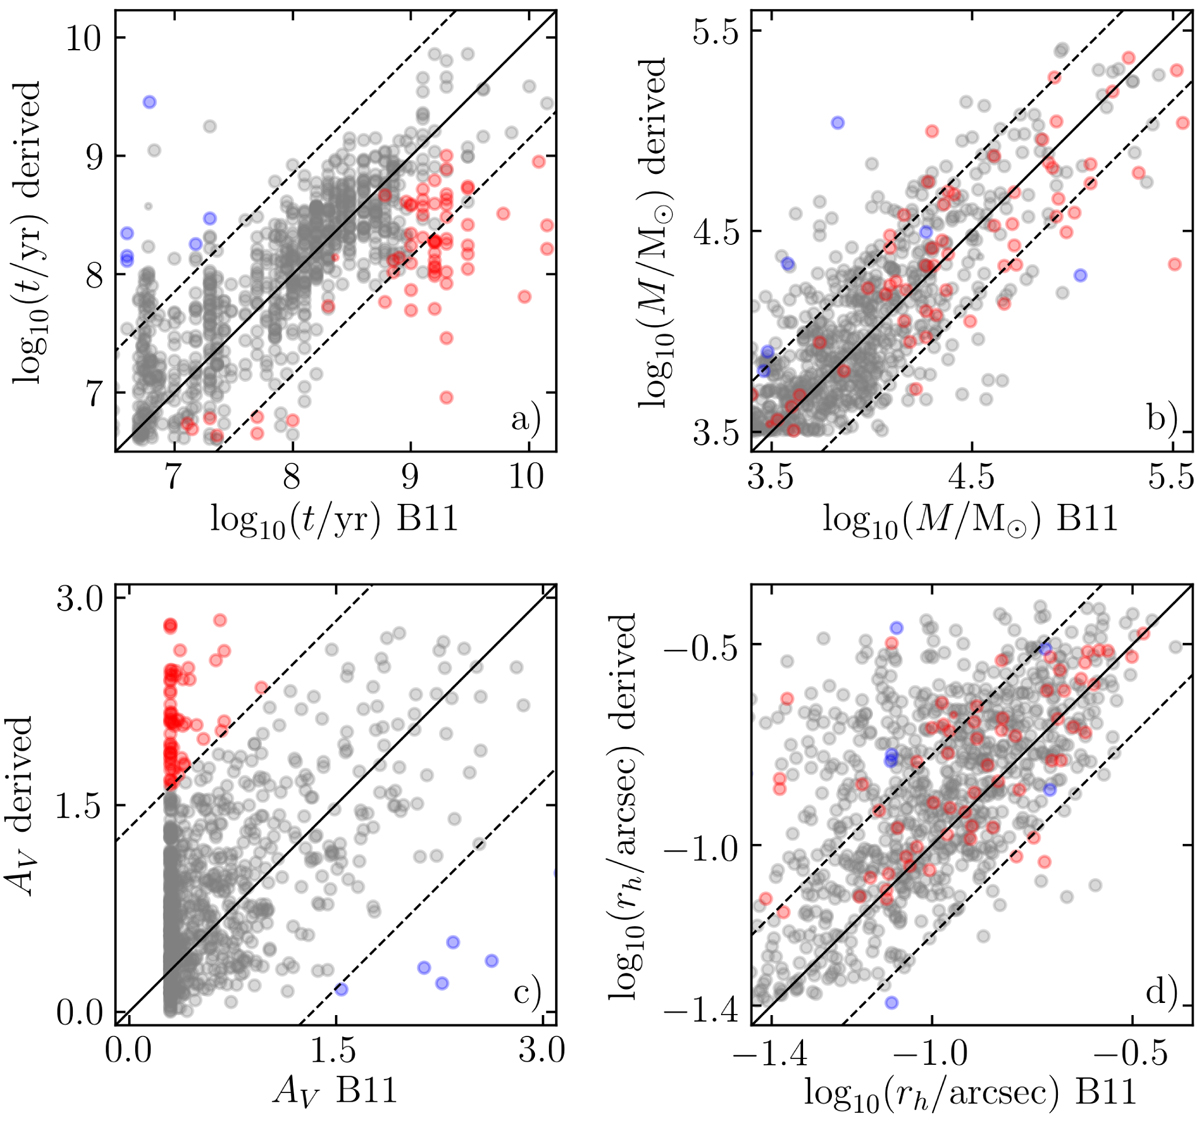
Comparisons for (a) age, (b) mass, (c) AV, and (d) rh derived by Bastian et al. (2011) and by CNN. The red dots represent clusters with overestimated, while the blue dots represent clusters with underestimated extinction values with respect to Bastian et al. (2011). The remaining clusters are shown in gray. The dashed lines outline the area containing 95% of the mock clusters.
Current usage metrics show cumulative count of Article Views (full-text article views including HTML views, PDF and ePub downloads, according to the available data) and Abstracts Views on Vision4Press platform.
Data correspond to usage on the plateform after 2015. The current usage metrics is available 48-96 hours after online publication and is updated daily on week days.
Initial download of the metrics may take a while.