Fig. 13.
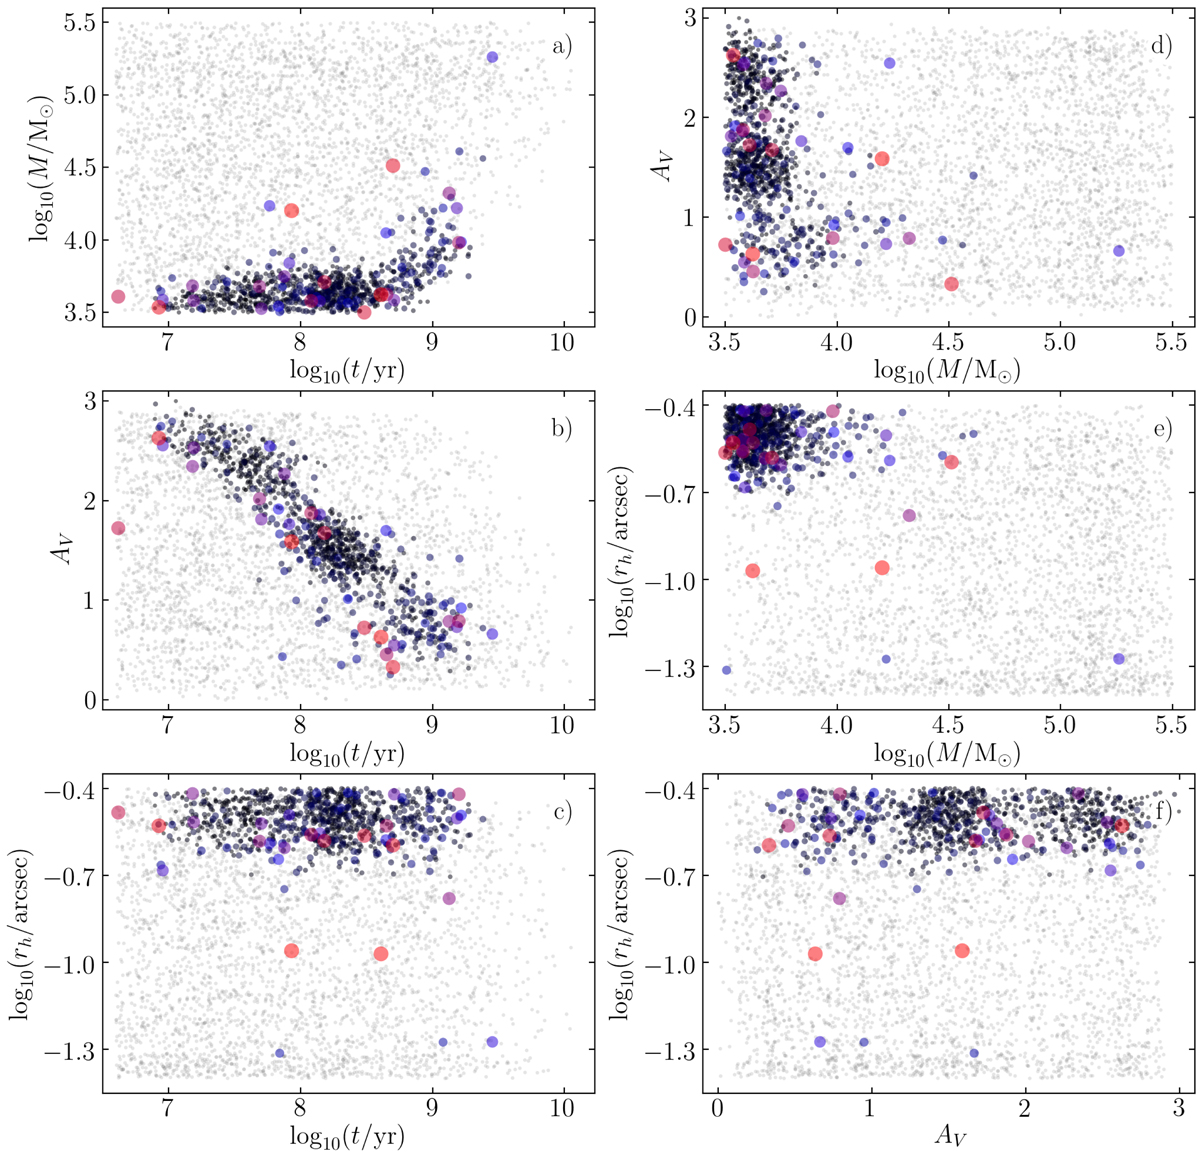
Same as in Fig. 12, but for 5000 randomly spatially sampled M 83 background images. For reference, derived mock cluster parameters are shown as faint gray dots. Real background samples are shown as black dots, which transition to blue and then to red. The dot size and color represents classc/b. The blue dots indicate objects with classc/b > 0.5 and the red dots indicate objects with classc/b > 0.99.
Current usage metrics show cumulative count of Article Views (full-text article views including HTML views, PDF and ePub downloads, according to the available data) and Abstracts Views on Vision4Press platform.
Data correspond to usage on the plateform after 2015. The current usage metrics is available 48-96 hours after online publication and is updated daily on week days.
Initial download of the metrics may take a while.