Fig. 12.
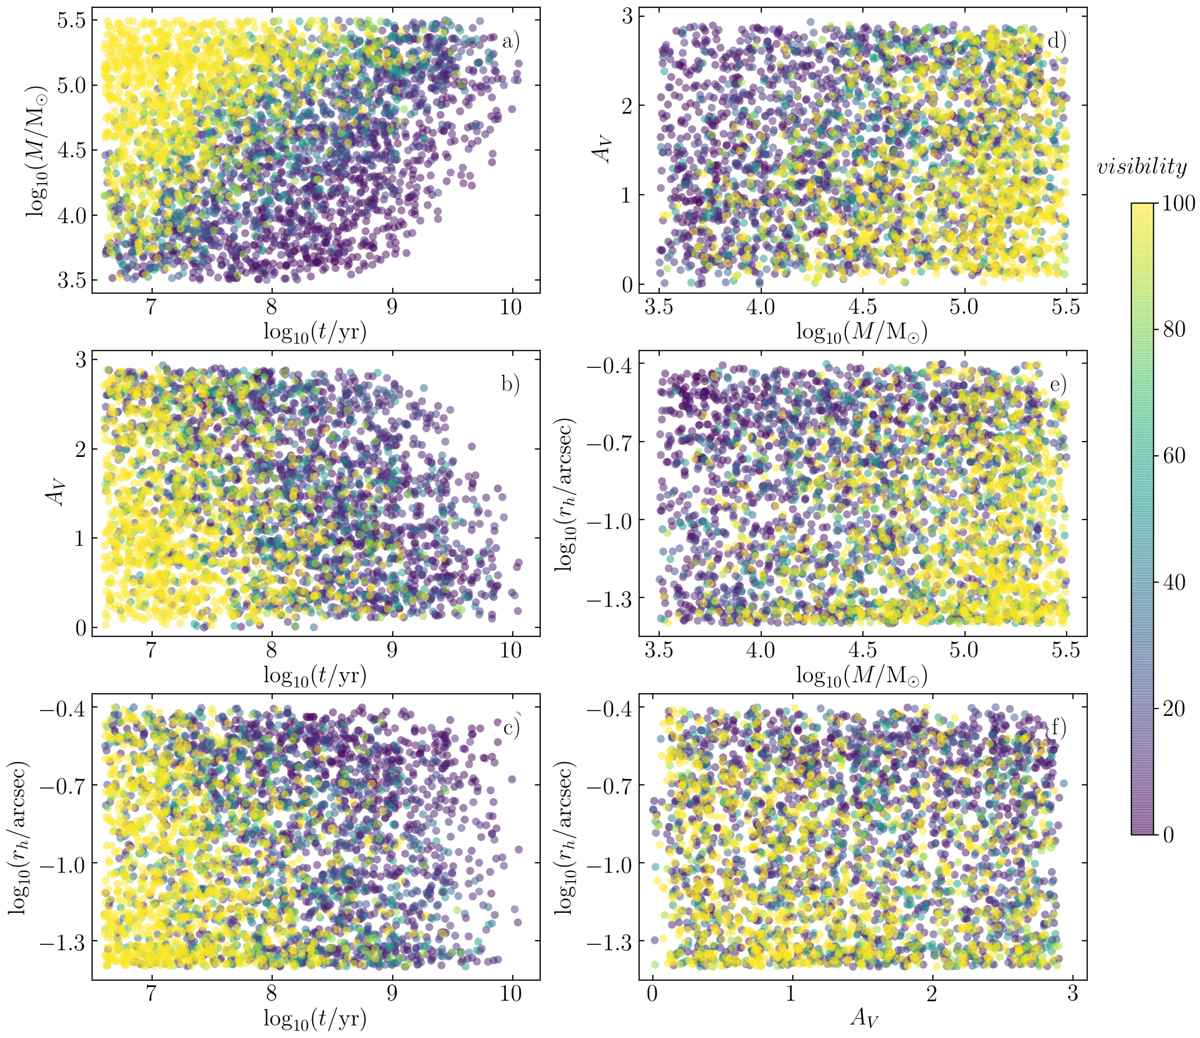
Inferred parameter distributions for the test cluster sample. The panels show the following parameter combinations: (a) mass vs. age, (b) extinction vs. age, (c) size vs. age, (d) extinction vs. mass, (e) size vs. mass, and (f) size vs. extinction. Diagonal cutoffs in panels (a) and (b) are related to the cluster detection limit, applied as magnitude cuts, shown in Fig. 3. The color map represents the visibility parameter, which acts as a proxy for the selection effects in a magnitude limited sample, while also taking into account variable cluster sizes and extinctions.
Current usage metrics show cumulative count of Article Views (full-text article views including HTML views, PDF and ePub downloads, according to the available data) and Abstracts Views on Vision4Press platform.
Data correspond to usage on the plateform after 2015. The current usage metrics is available 48-96 hours after online publication and is updated daily on week days.
Initial download of the metrics may take a while.