Fig. 11.
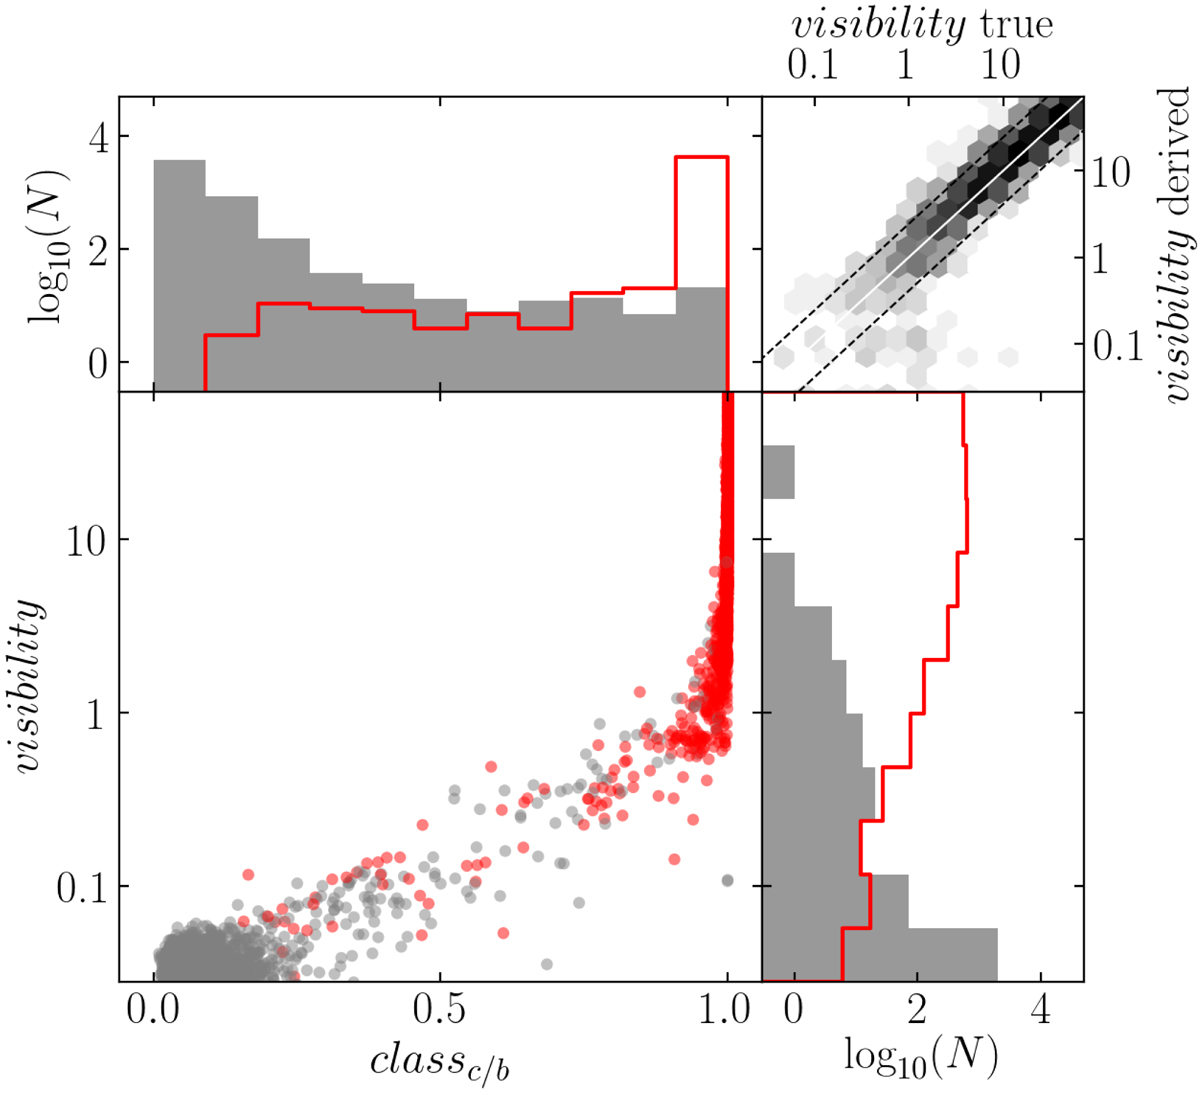
Visibility parameter values vs. classc/b for mock (red) and random M 83 field (gray) samples. The histograms are marginalized logarithmic counts of samples for visibility (right) and classc/b (top). Top right panel: true vs. derived visibility parameters of mock clusters as a logarithmic density map; dashed lines outline the area containing 95% of the clusters.
Current usage metrics show cumulative count of Article Views (full-text article views including HTML views, PDF and ePub downloads, according to the available data) and Abstracts Views on Vision4Press platform.
Data correspond to usage on the plateform after 2015. The current usage metrics is available 48-96 hours after online publication and is updated daily on week days.
Initial download of the metrics may take a while.