Fig. 1.
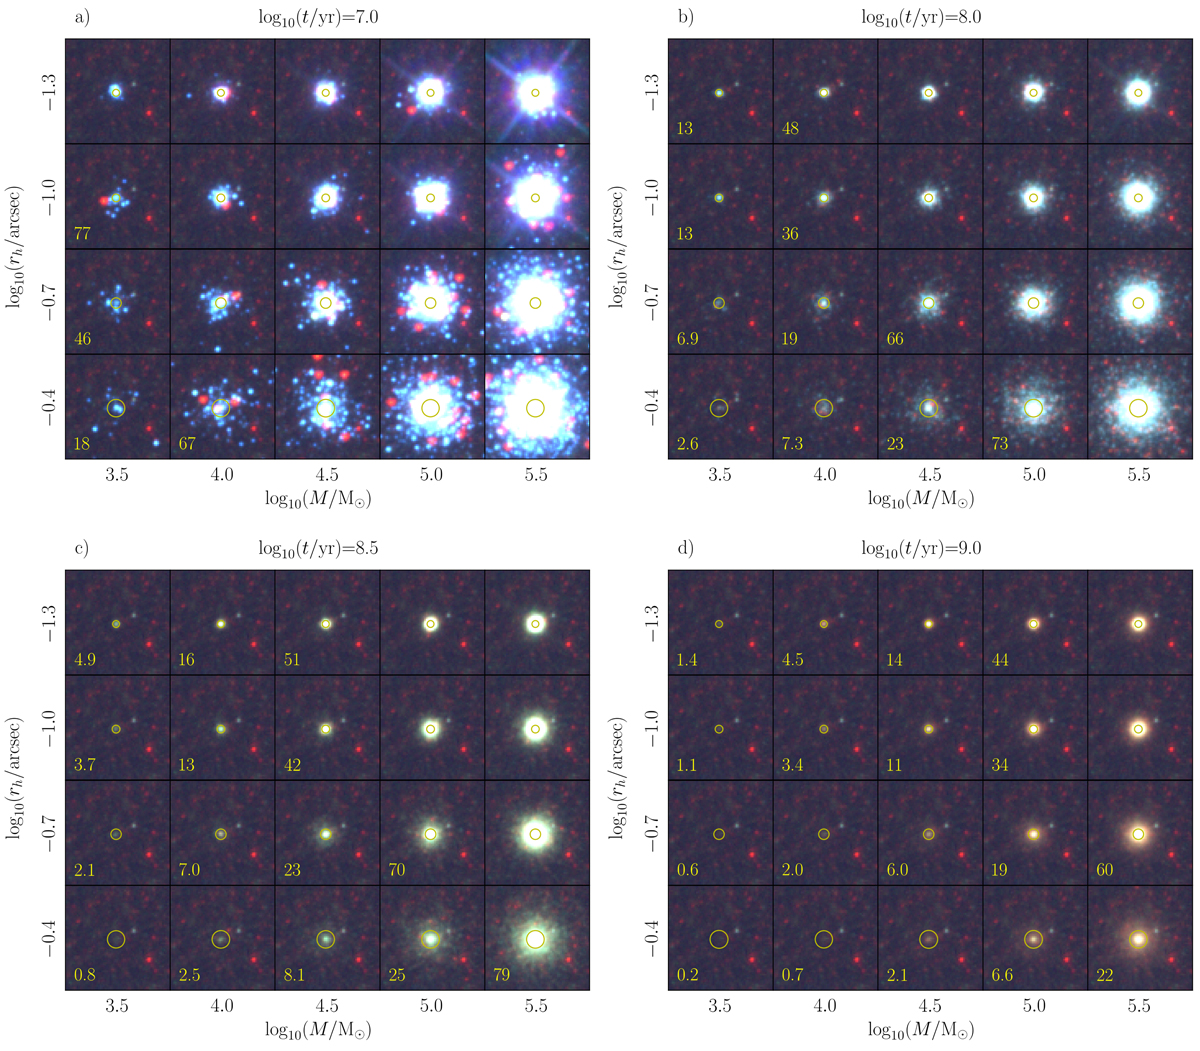
Examples of generated mock clusters placed on a real background image, which is the same for all panels. The ages of the clusters are shown top of each panel. The mass and size, rh, values are varied as shown on the axes; extinction AV = 0 mag. The intensity scale of the images was normalized with the arcsinh function within identical pixel value limits for each image. The yellow circles represent rh, obs values (rh convolved with the PSF). The value of the visibility, i.e., S/N proxy, is shown on the bottom left of each image for fainter objects with visibility < 100. Image sizes are 64 × 64 pixels (2.6 × 2.6 arcsec) or ∼60 × 60 pc at the distance of M 83. In the images red corresponds to passband F814W, green to F438W, and blue to F336W.
Current usage metrics show cumulative count of Article Views (full-text article views including HTML views, PDF and ePub downloads, according to the available data) and Abstracts Views on Vision4Press platform.
Data correspond to usage on the plateform after 2015. The current usage metrics is available 48-96 hours after online publication and is updated daily on week days.
Initial download of the metrics may take a while.