Fig. A.1.
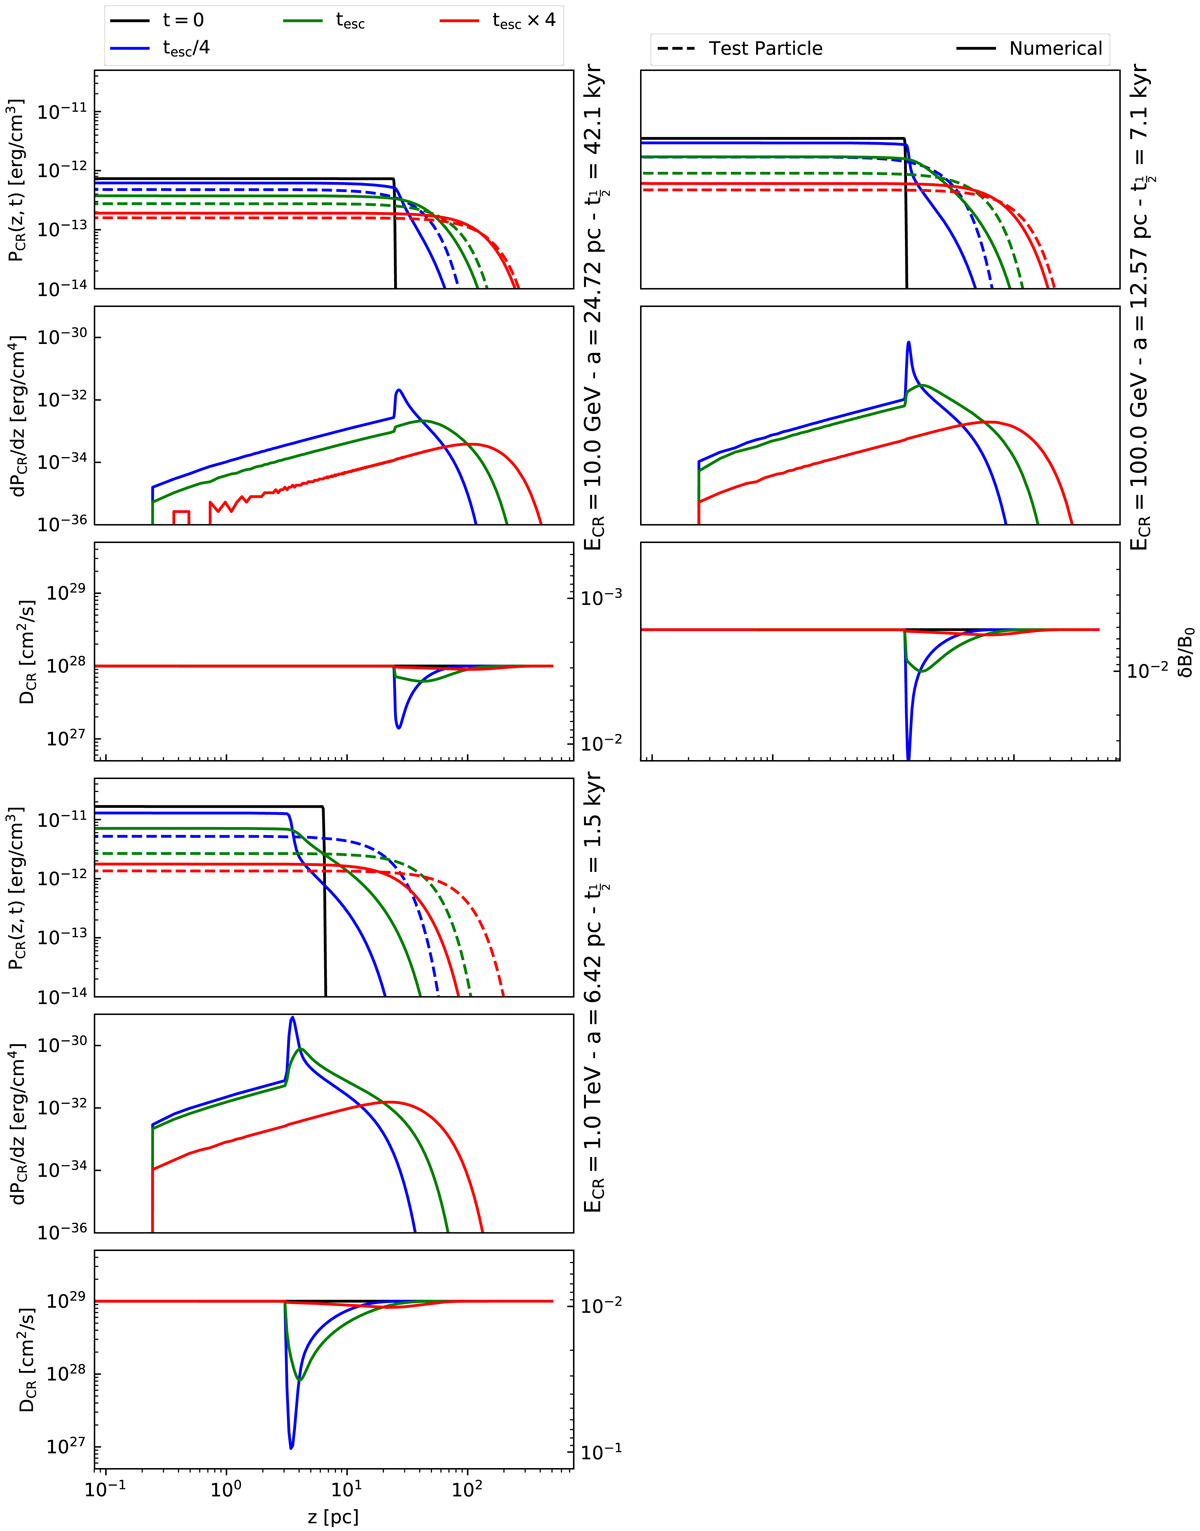
Time evolution of a CRC of initial radius a in the WNM phase for model 𝒫. The results at 10 GeV, 100 GeV, 1 TeV, and 10 TeV are shown from the left to the right and the top to the bottom. Each panel presents three plots and shows CR pressure evolution as a function of space for three times (top), the CR pressure gradient evolution (middle), and diffusion coefficients (bottom). Blue, green, and red refer to t1/2/4, t1/2, and 4t1/2, respectively. The initial CR pressure distribution is represented by a thin black dashed line. The same typography is used for the background diffusion coefficient. Numerical solutions are represented with solid lines while test-particle solutions are presented by dashed lines.
Current usage metrics show cumulative count of Article Views (full-text article views including HTML views, PDF and ePub downloads, according to the available data) and Abstracts Views on Vision4Press platform.
Data correspond to usage on the plateform after 2015. The current usage metrics is available 48-96 hours after online publication and is updated daily on week days.
Initial download of the metrics may take a while.