Fig. 5.
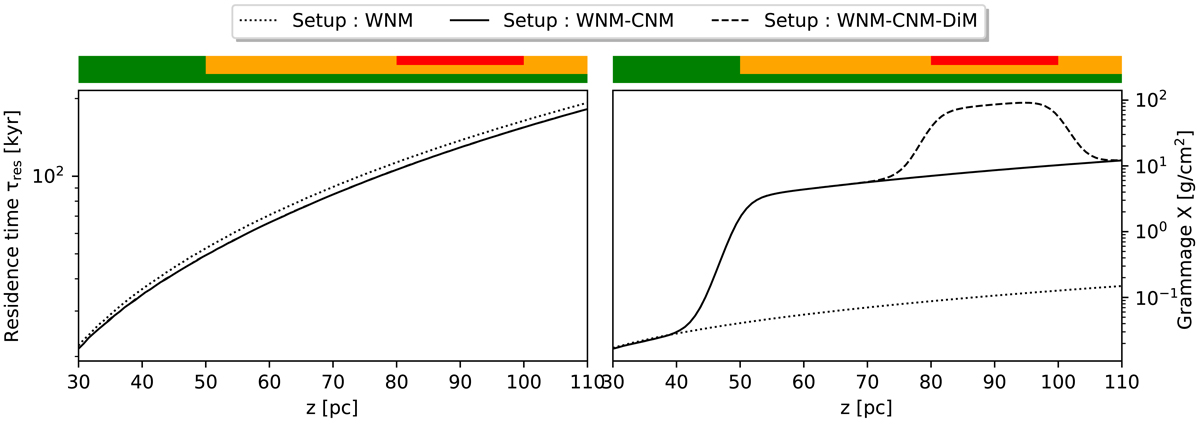
Evolution of the CR grammage (right part) and residence time (left part) in Setup 1: WNM-CNM and Setup 2: WNM-CNM-DiM represented by a solid curve and a dashed curve, respectively. These setups are compared with the case of the expansion of a CRC in a homogeneous WNM represented by the dotted lines. Each setup phase configuration is represented by a color code: WNM (green), CNM (orange), and DiM (red).
Current usage metrics show cumulative count of Article Views (full-text article views including HTML views, PDF and ePub downloads, according to the available data) and Abstracts Views on Vision4Press platform.
Data correspond to usage on the plateform after 2015. The current usage metrics is available 48-96 hours after online publication and is updated daily on week days.
Initial download of the metrics may take a while.