Fig. 4.
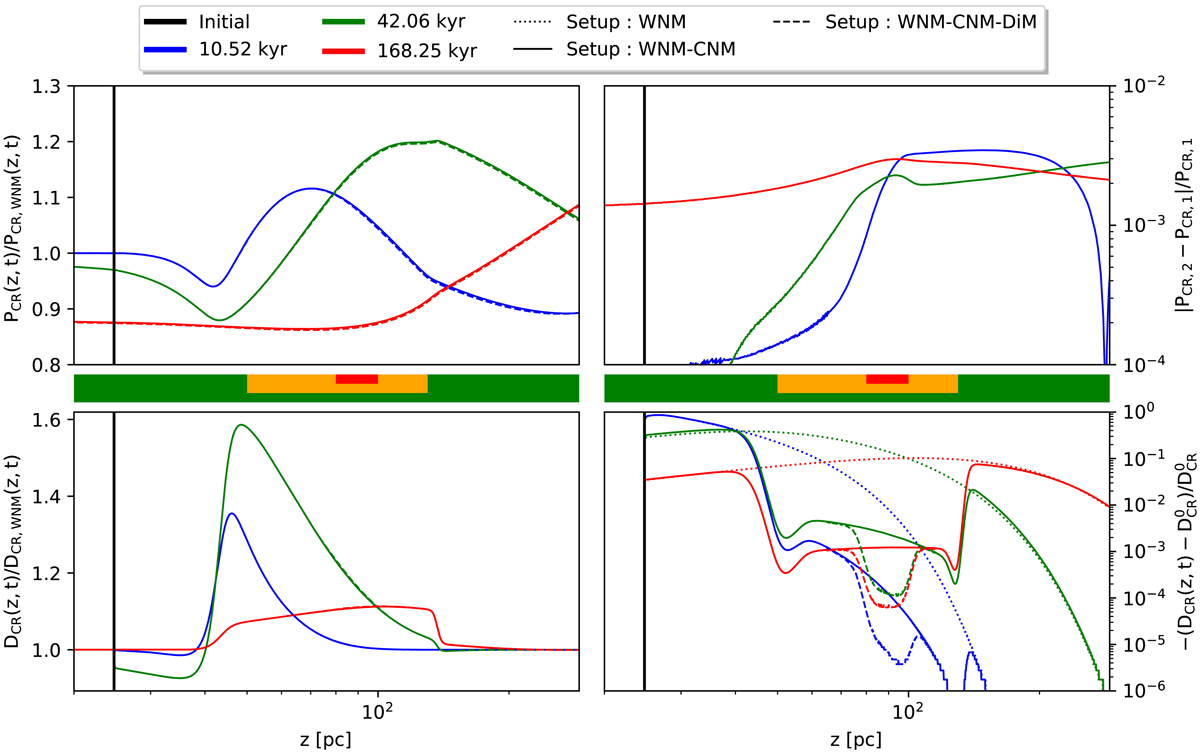
Evolution of the CR pressure (top figures) and their associated diffusion coefficient (bottom panels) in space at different times of the simulation based on the CRC half-life time for 10 GeV CRs in the WNM: 10.52 kyr (blue), 42.06 kyr (green), and 168.25 kyr (red). The simulation setups are represented by the different line styles: solid line for the WNM-CNM, dashed line for the WNM-CNM-DiM, and dotted line for the homogeneous WNM. The vertical black lines represent the initial size of the CRC. The phase decomposition for each setup is represented between the figures by the colored lines: green for WNM, orange for CNM, and red for DiM. Top-left figure: relative evolution of the CR pressure for WNM-CNM and WNM-CNM-DiM setups compared to the CR pressure evolution in the case of propagation in a homogeneous WNM phase. Top-right panel: relative CR pressure evolution for the WNM-CNM-DiM (PCR, 2) and the WNM-CNM (PCR, 1) setups, respectively. Bottom-left panel: relative evolution of the CR diffusion coefficients compared to the evolution of the CR diffusion coefficient in the case of propagation in a homogeneous WNM phase. Bottom-right panel: normalized relative evolution of the CR diffusion coefficient around the CNM and CNM-DiM phases. We recall that ![]() .
.
Current usage metrics show cumulative count of Article Views (full-text article views including HTML views, PDF and ePub downloads, according to the available data) and Abstracts Views on Vision4Press platform.
Data correspond to usage on the plateform after 2015. The current usage metrics is available 48-96 hours after online publication and is updated daily on week days.
Initial download of the metrics may take a while.