Fig. 3.
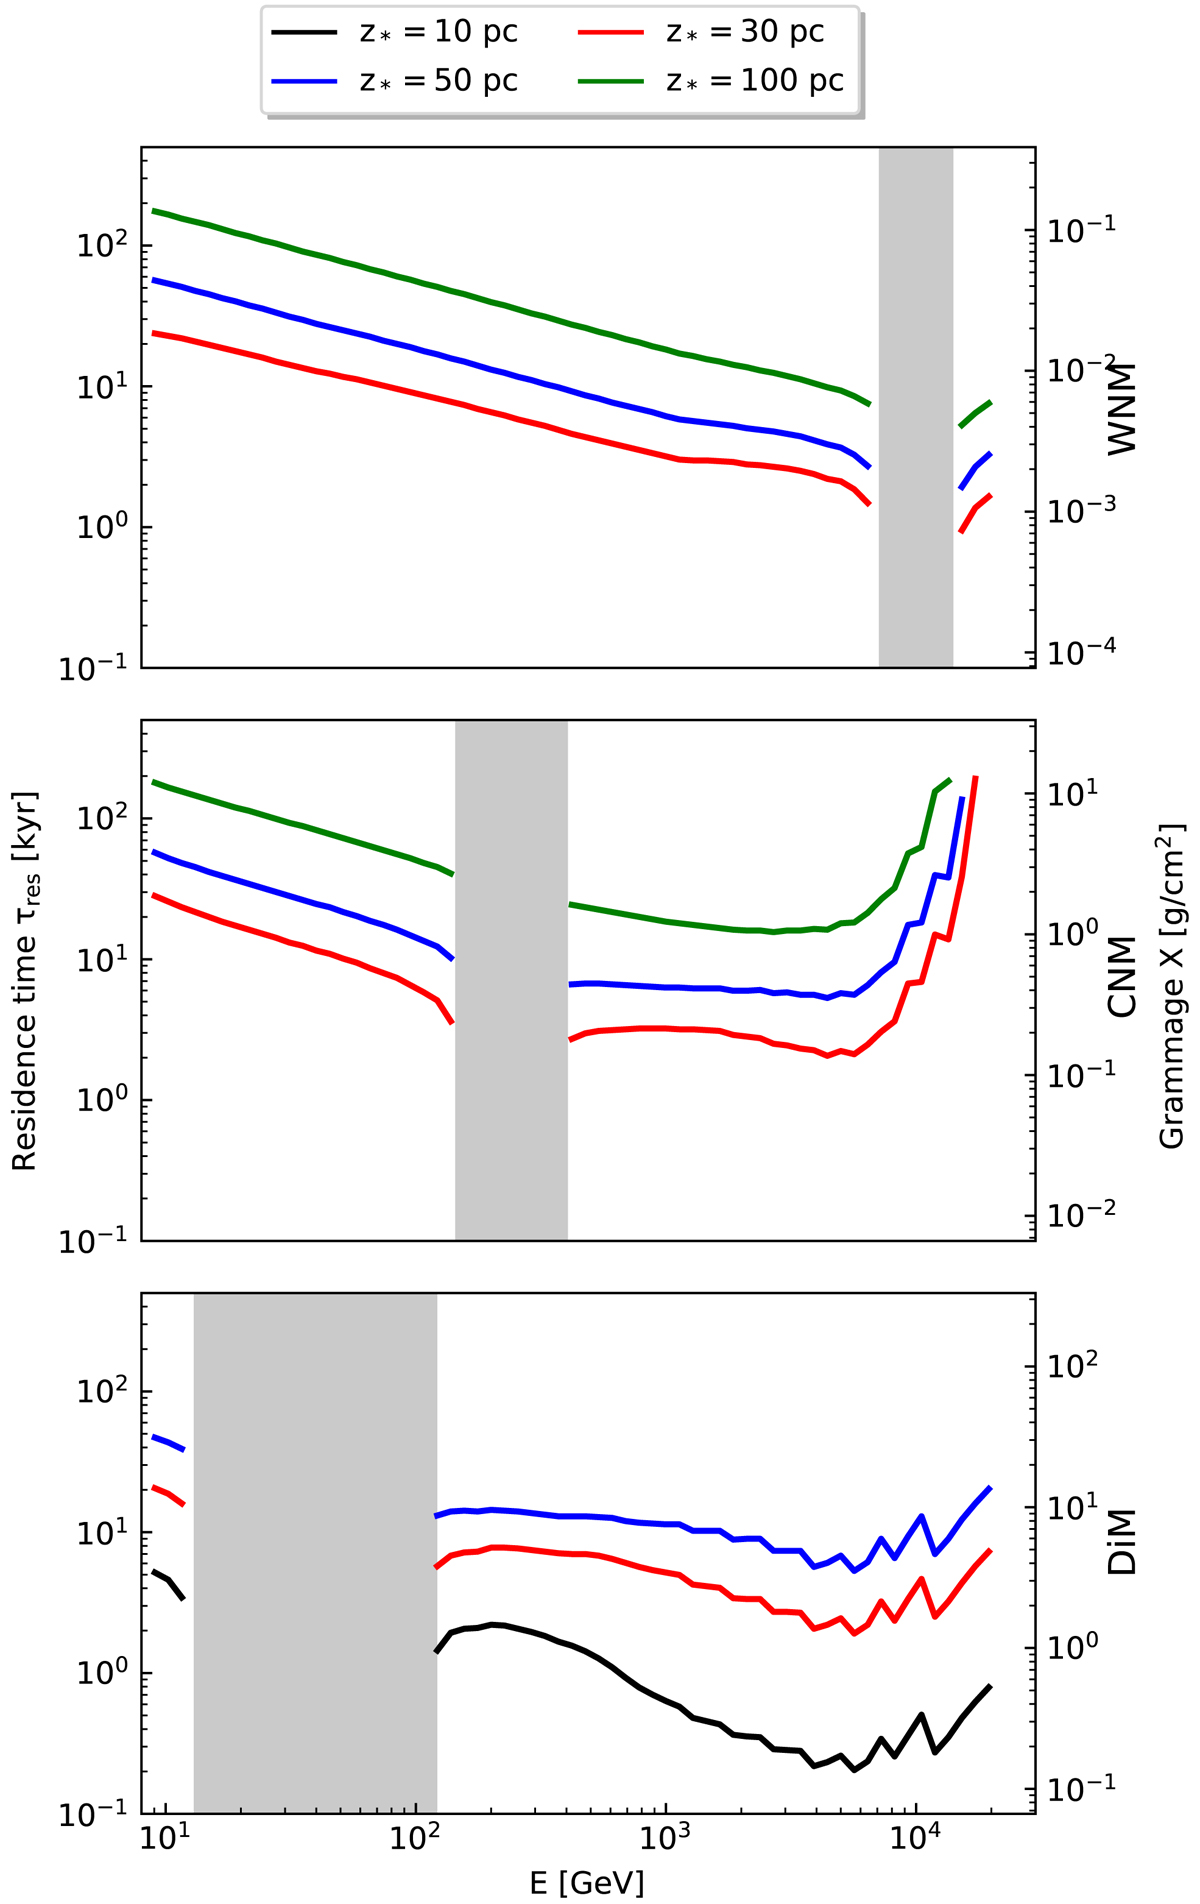
Grammage (right vertical axis) and residence time (left vertical axis) of CRs as a function of their energy in three different phases of the ISM : WNM (top), CNM (middle), and DiM (bottom). Solid lines show the results obtained at different distances z* from the center of the source: green (100 pc), blue (50 pc), red (30 pc), and black (10 pc). The shaded region marks the no-wave propagation zone. Oscillations at high energy in the CNM and DiM are due to the limited energy resolution used to reconstruct the different curves.
Current usage metrics show cumulative count of Article Views (full-text article views including HTML views, PDF and ePub downloads, according to the available data) and Abstracts Views on Vision4Press platform.
Data correspond to usage on the plateform after 2015. The current usage metrics is available 48-96 hours after online publication and is updated daily on week days.
Initial download of the metrics may take a while.