Fig. 2.
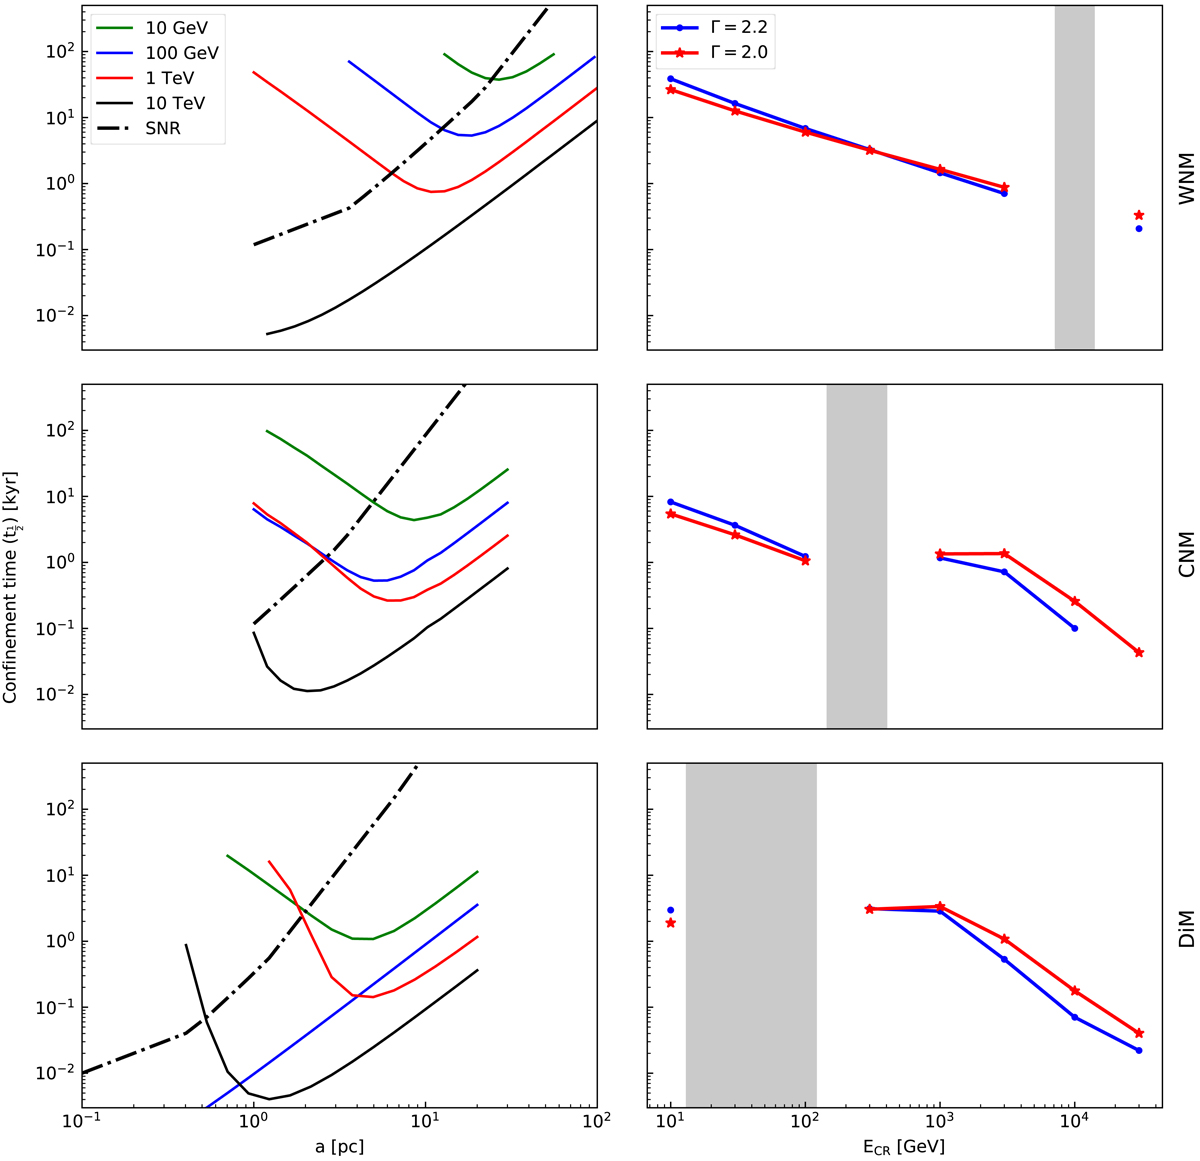
Properties of the expansion of the CRC in the ISM. Left: evolution of the half-life time of the CRC as a function of its initial radius a in parsec units. Green, blue, red, and black solid lines refer to particle energies at 10, 102, 103, and 104 GeV. The black dashed line refers to the time evolution of the radius of the SNR front shock in the considered phase: WNM for the top figure, CNM for the middle one, and DiM for the bottom one. These plots have been obtained for Γ = 2.2. Right: evolution of the half-life time of the CRC derived from the left plots as a function of CR energy. The blue solid line refers to a CR energy spectral index of 2.2 while the red dashed line refers to a spectral index of 2.0. The gray zone corresponds to the no-wave propagation zone; it does not lead to any (a, t1/2) solution.
Current usage metrics show cumulative count of Article Views (full-text article views including HTML views, PDF and ePub downloads, according to the available data) and Abstracts Views on Vision4Press platform.
Data correspond to usage on the plateform after 2015. The current usage metrics is available 48-96 hours after online publication and is updated daily on week days.
Initial download of the metrics may take a while.