Fig. 6
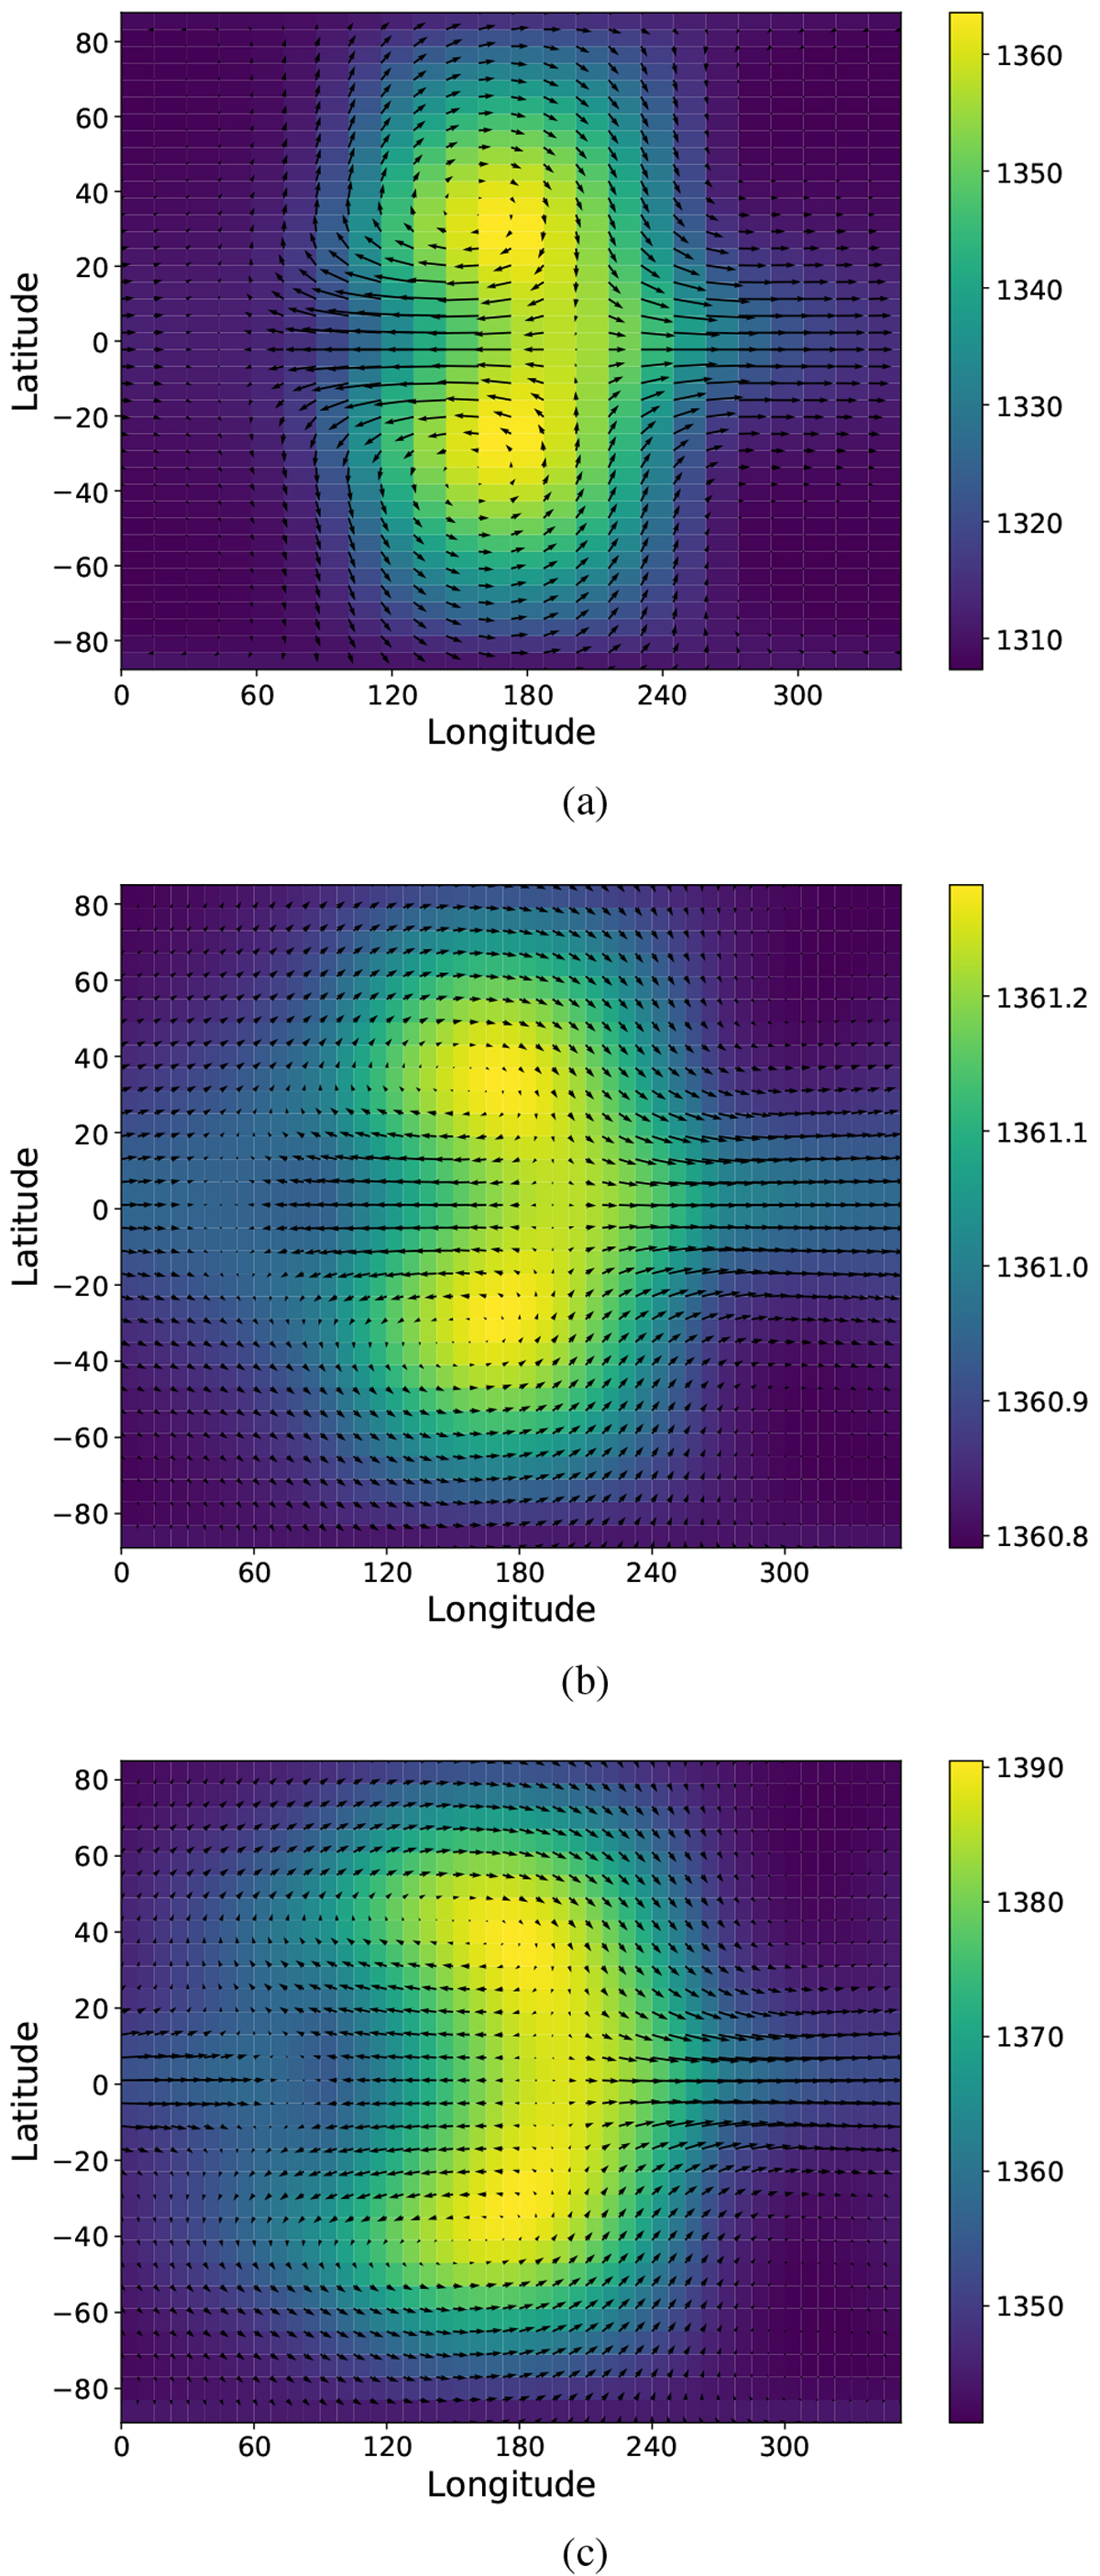
Temperature (color) and winds (arrows) as a function of longitude and latitude for (a) linear steady state calculated with ECLIPS3D with ΔTeq,top = 100 K, τdrag =2 × 10⁵ s and τrad following Iro et al. (2005). Maximum speed is 400 m s−1 (b): 3D GCM result at the 80 mbar level after 10 days of simulation, with ΔTeq,top = 1 K and the radiative timescale of Iro et al. (2005). The maximum speed is 2.5 m s−1; (c): 3D GCM result at the 80 mbar level after 10 days of simulation, with ΔTeq,top = 100 K and the radiative timescale of Iro et al. (2005). The maximum speed is 350 m s−1
Current usage metrics show cumulative count of Article Views (full-text article views including HTML views, PDF and ePub downloads, according to the available data) and Abstracts Views on Vision4Press platform.
Data correspond to usage on the plateform after 2015. The current usage metrics is available 48-96 hours after online publication and is updated daily on week days.
Initial download of the metrics may take a while.