Fig. 1
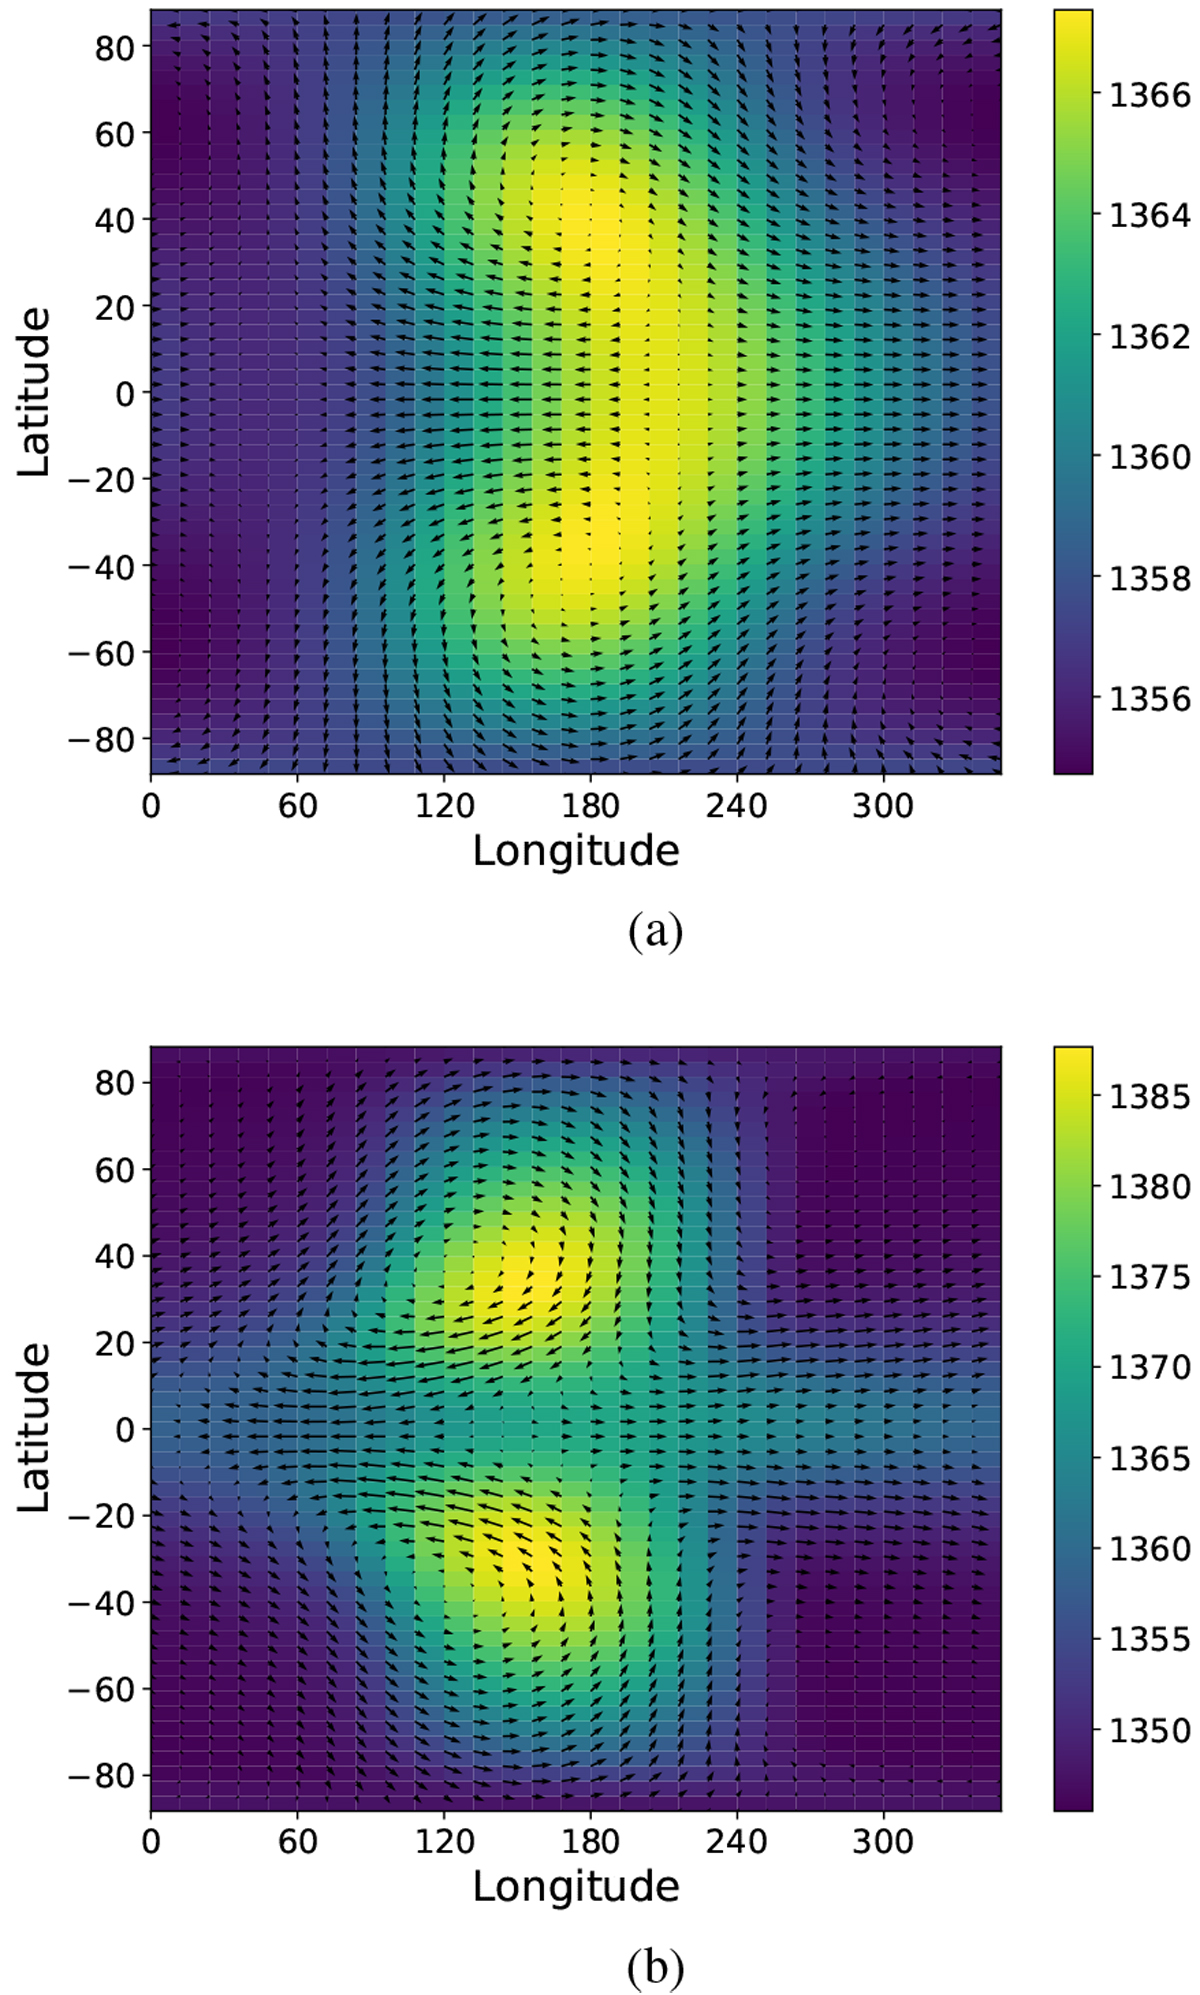
Temperature (colorscale in K) and horizontal wind (arrows) as a function of longitude (x axis) and latitude (y axis) at the 40 mbar pressure level of the linear steady state (denominated MG circulation) obtained using ECLIPS3D (Debras et al. 2019) with heating function, drag and radiative timescales following the definitions of Komacek & Showman (2016). Following the notation of Komacek & Showman (2016): (a) ΔTeq,top= 100 K, τdrag,top = 105 s and τrad,top = 105 s. The maximum speed at this pressure range is 10 m s−1. (b) ΔTeq,top = 100 K, τdrag,top = 106 s and τrad,top = 104 s. The maximum speed at this pressure range is 100 m s−1. Note that the maximum speed has been multiplied by ten as the drag timescale has been multiplied by ten.
Current usage metrics show cumulative count of Article Views (full-text article views including HTML views, PDF and ePub downloads, according to the available data) and Abstracts Views on Vision4Press platform.
Data correspond to usage on the plateform after 2015. The current usage metrics is available 48-96 hours after online publication and is updated daily on week days.
Initial download of the metrics may take a while.