Open Access
Fig. 7
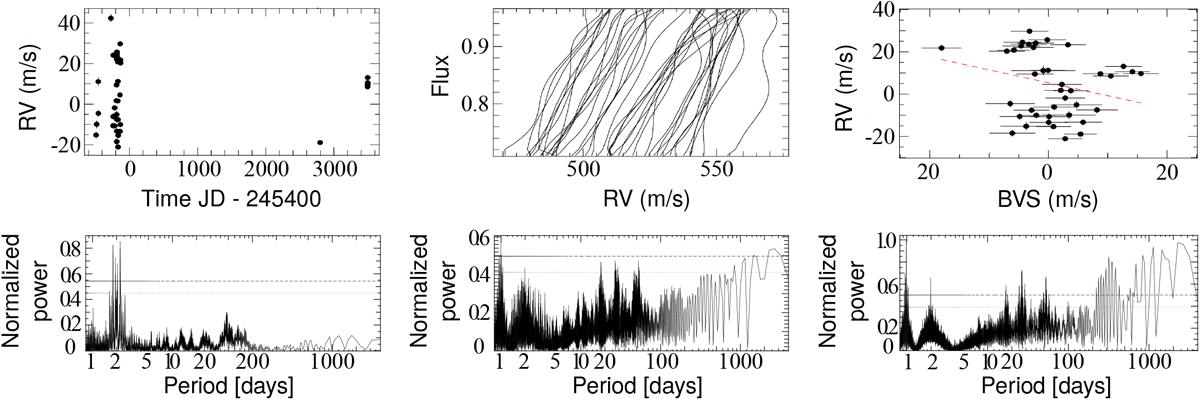
BD+20 2465 summary. Top row: RV time variations, left: bisectors, middle: RV vs BVS (right). Bottom row: RV periodogram (left), BVS periodogram (middle), time window peridogram (right). The FAP at 1 and 10% are presented respectively in dashed lines and in dotted lines.
Current usage metrics show cumulative count of Article Views (full-text article views including HTML views, PDF and ePub downloads, according to the available data) and Abstracts Views on Vision4Press platform.
Data correspond to usage on the plateform after 2015. The current usage metrics is available 48-96 hours after online publication and is updated daily on week days.
Initial download of the metrics may take a while.