Fig. 5
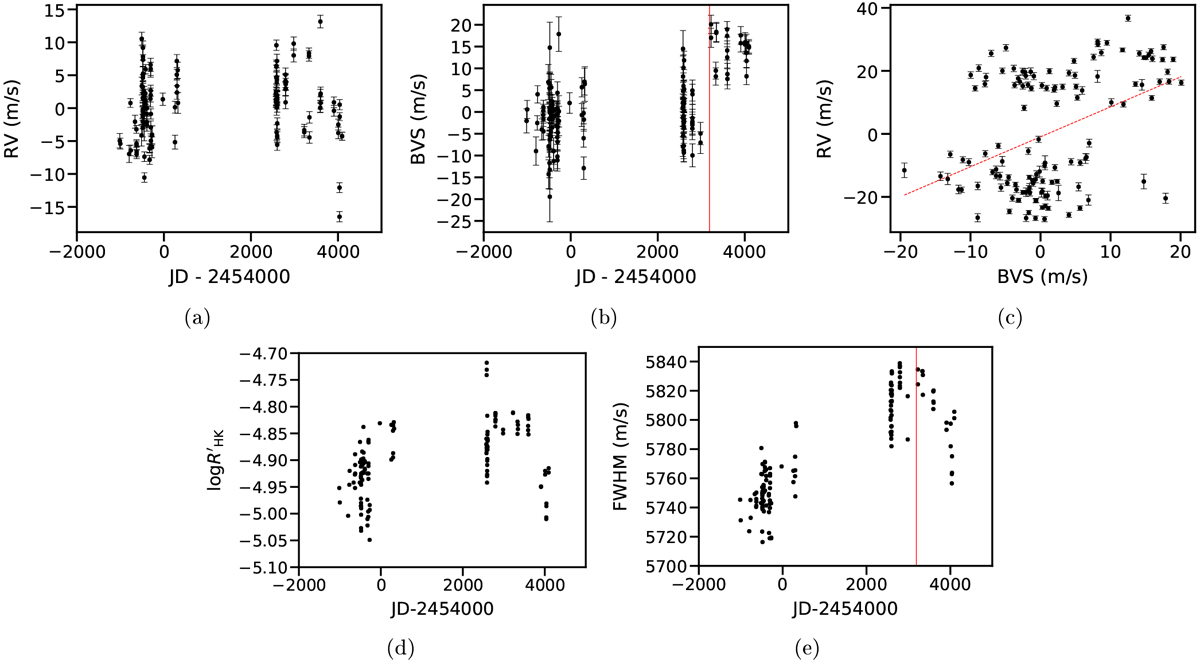
HD 217987 summary. (a) RV time variations corrected from the secular acceleration drift. (b) BVS time variations, HARPS fiber change is shown with a vertical red line. (c) RV corrected from the secular acceleration drift vs BVS. The best linear fit is presentend in red dashed line. (d) log ![]() time variations. (e) FWHM time variations.
time variations. (e) FWHM time variations.
Current usage metrics show cumulative count of Article Views (full-text article views including HTML views, PDF and ePub downloads, according to the available data) and Abstracts Views on Vision4Press platform.
Data correspond to usage on the plateform after 2015. The current usage metrics is available 48-96 hours after online publication and is updated daily on week days.
Initial download of the metrics may take a while.