Open Access
Fig. 2
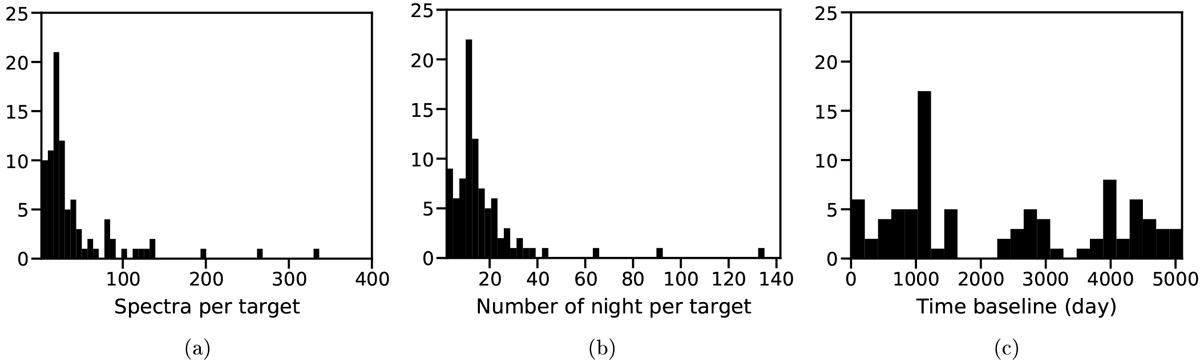
Observation summary. (a) Histogram of the number of spectra per target, excluding HD 216956 (Fomalhaut, 834 spectra) and HD 039060 (β Pic, 5108 spectra). (b) Histogram of the number of nights per target. (c) Histogram of the time baselines.
Current usage metrics show cumulative count of Article Views (full-text article views including HTML views, PDF and ePub downloads, according to the available data) and Abstracts Views on Vision4Press platform.
Data correspond to usage on the plateform after 2015. The current usage metrics is available 48-96 hours after online publication and is updated daily on week days.
Initial download of the metrics may take a while.