Fig. 6.
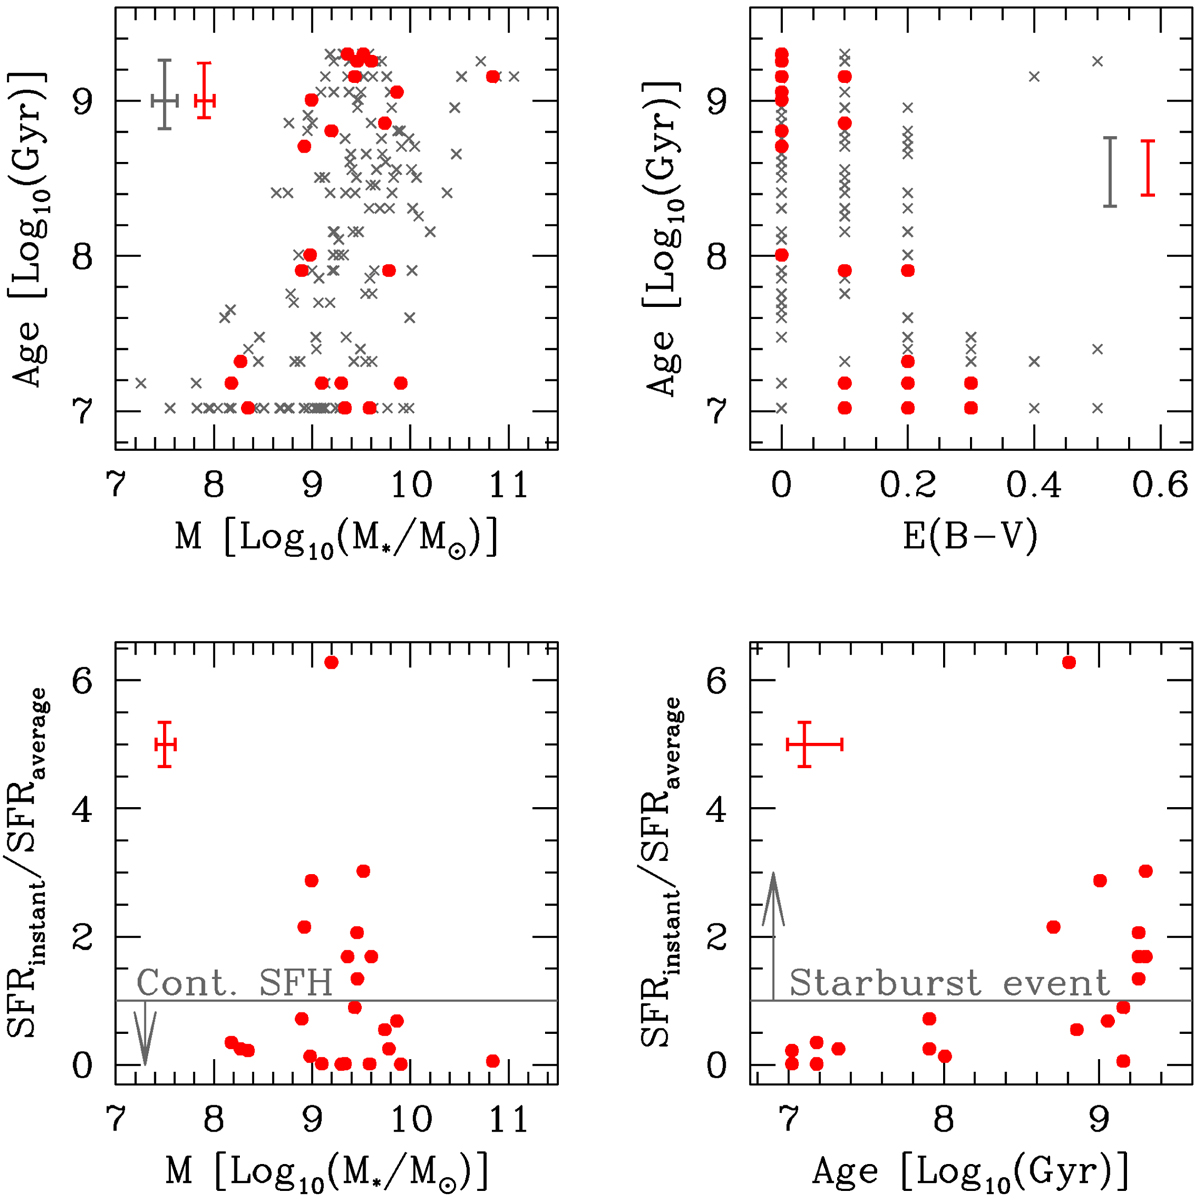
Upper panels: mass–age relation on the left and E(B − V)–age relation on the right for both our SMUVS detected samples. Here, SMUVS/MUSE is represented in red, while SMUVS/notMUSE is plotted in gray. We see that the older objects are generally more massive and that the younger objects experience generally more extinction than older objects. Lower panels: test of the lower limit of the instantaneous SFR derived from our Lyα flux measurements against an average star formation rate obtained by dividing the stellar mass by the age of the galaxy obtained from the SED fit. We see on the left that the higher SFR is associated with intermediate-mass objects, and on the right that older objects have a higher SFR than what would be expected if they had continuously formed stars in one single episode. The gray line in the plots indicates where the ratio between SFRs is unity. The error bars shown in the plots are representative of the average errors on the galactic properties.
Current usage metrics show cumulative count of Article Views (full-text article views including HTML views, PDF and ePub downloads, according to the available data) and Abstracts Views on Vision4Press platform.
Data correspond to usage on the plateform after 2015. The current usage metrics is available 48-96 hours after online publication and is updated daily on week days.
Initial download of the metrics may take a while.