Fig. 3.
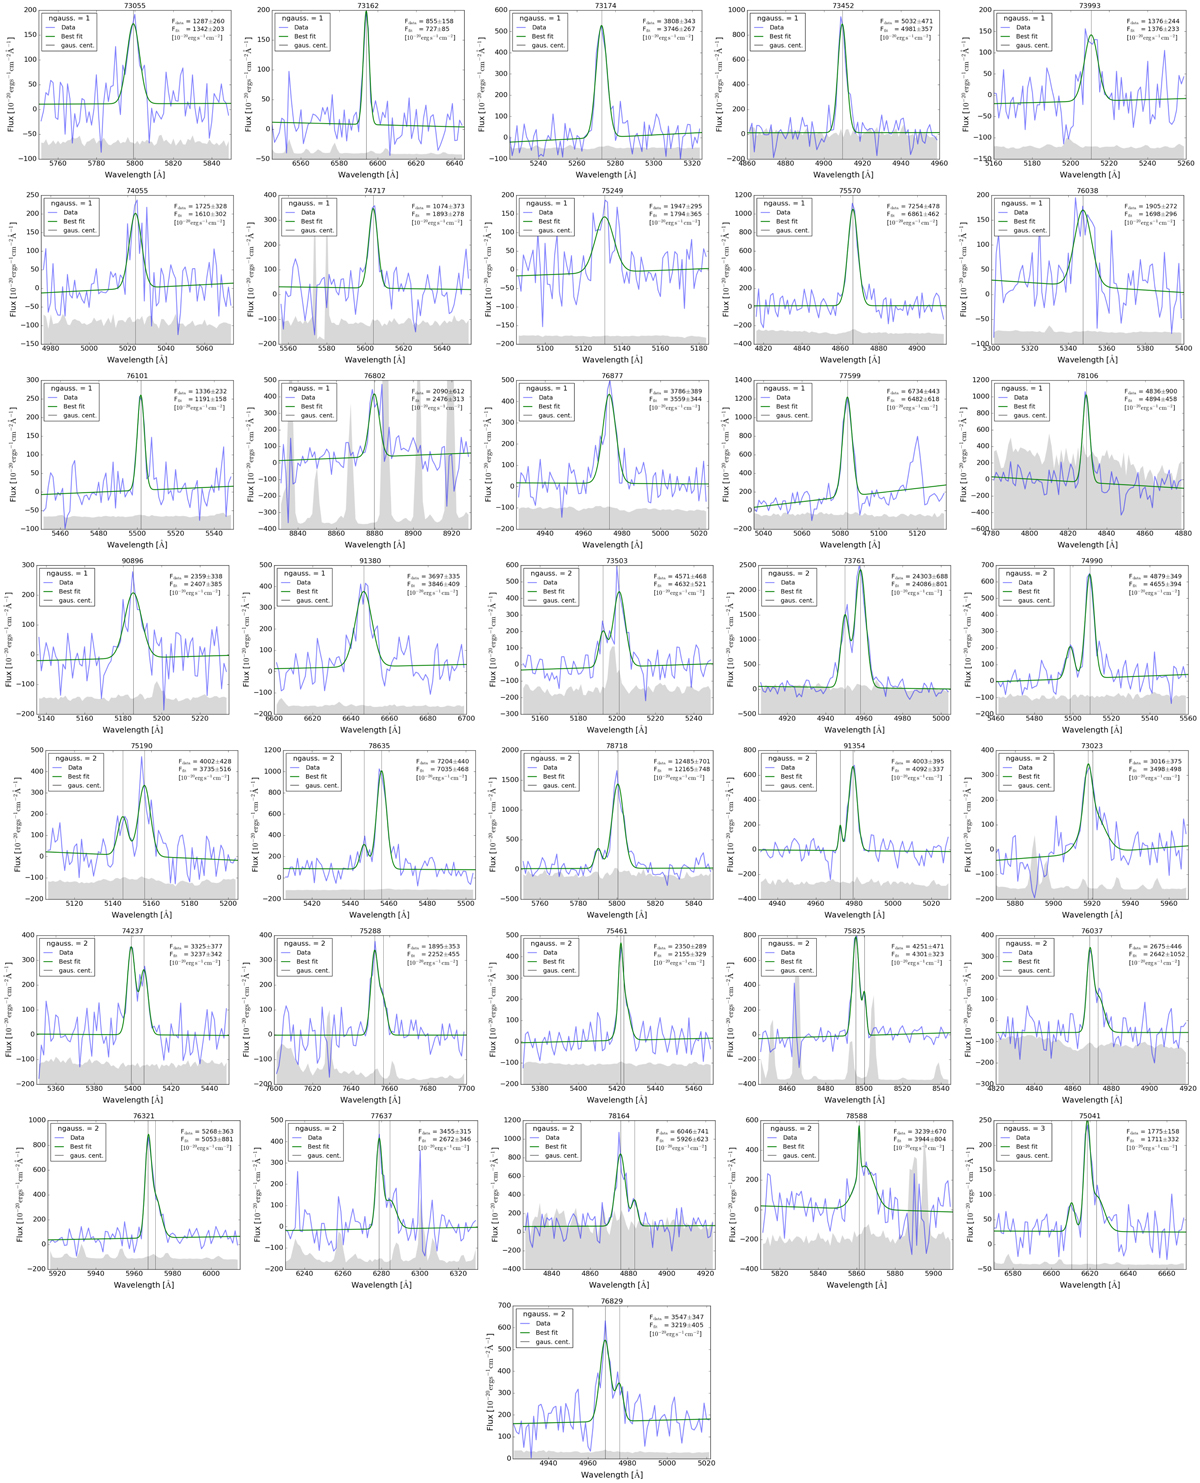
Zoomed-in image of the spectra of our MUSE/SMUVS Lyα emitters. The wavelength range is chosen so that the Lyα line is visible and centered in the plot. The fit is performed by extracting the spectrum from the MUSE data cube in the region where the Lyα emission is ∼3σ above the background or covers at least 50 pixels. The number of Gaussians used in the fit is determined after visual inspection of the shape of the spectrum and serves purely to measure the flux. All three line profiles are represented here.
Current usage metrics show cumulative count of Article Views (full-text article views including HTML views, PDF and ePub downloads, according to the available data) and Abstracts Views on Vision4Press platform.
Data correspond to usage on the plateform after 2015. The current usage metrics is available 48-96 hours after online publication and is updated daily on week days.
Initial download of the metrics may take a while.