Free Access
Fig. 1.
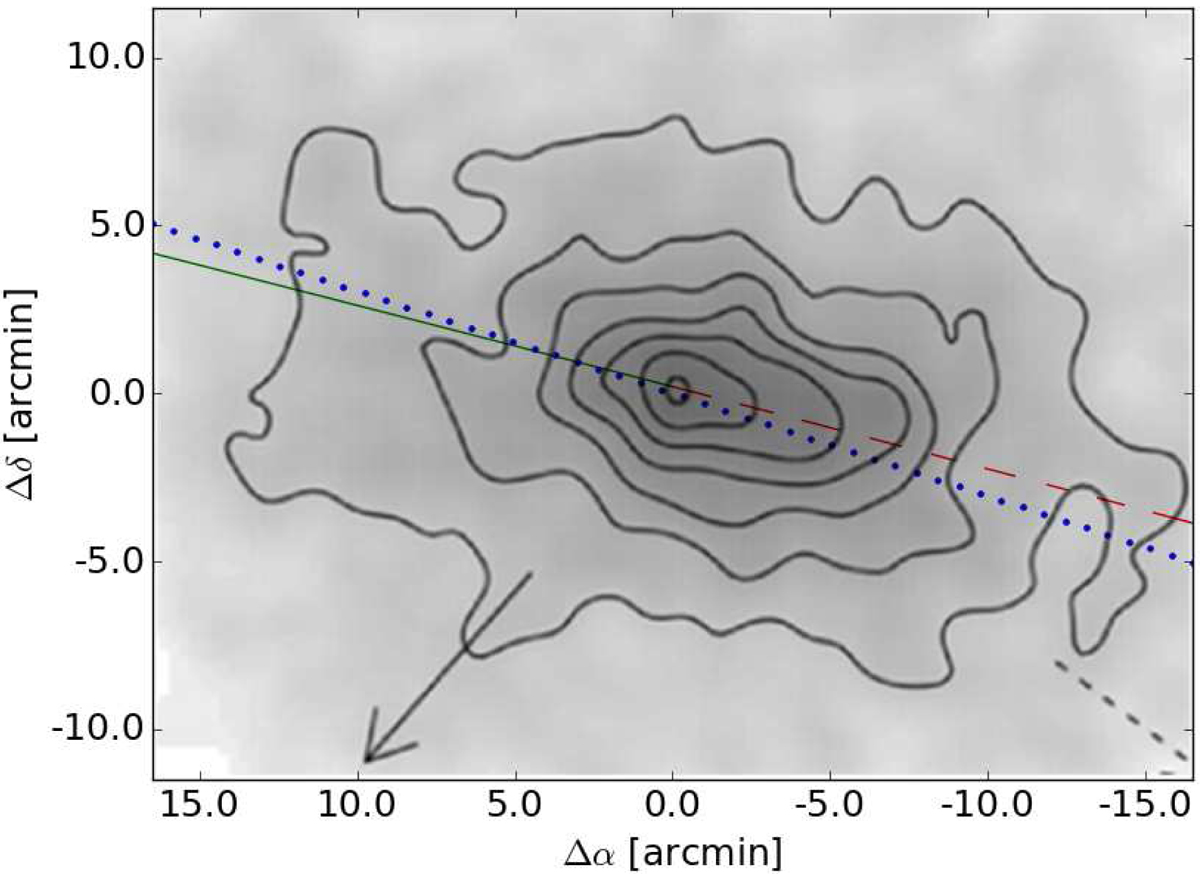
Projected orbit of CVn I dSph on the sky. The red dashed line represents the past position of CVn I dSph, while the green line corresponds to the future position of the galaxy. The blue dots are aligned to the major axis of the dwarf. The isodensity contour plot was adapted from Okamoto et al. (2012), Fig. 8.
Current usage metrics show cumulative count of Article Views (full-text article views including HTML views, PDF and ePub downloads, according to the available data) and Abstracts Views on Vision4Press platform.
Data correspond to usage on the plateform after 2015. The current usage metrics is available 48-96 hours after online publication and is updated daily on week days.
Initial download of the metrics may take a while.