Free Access
Fig. 8.
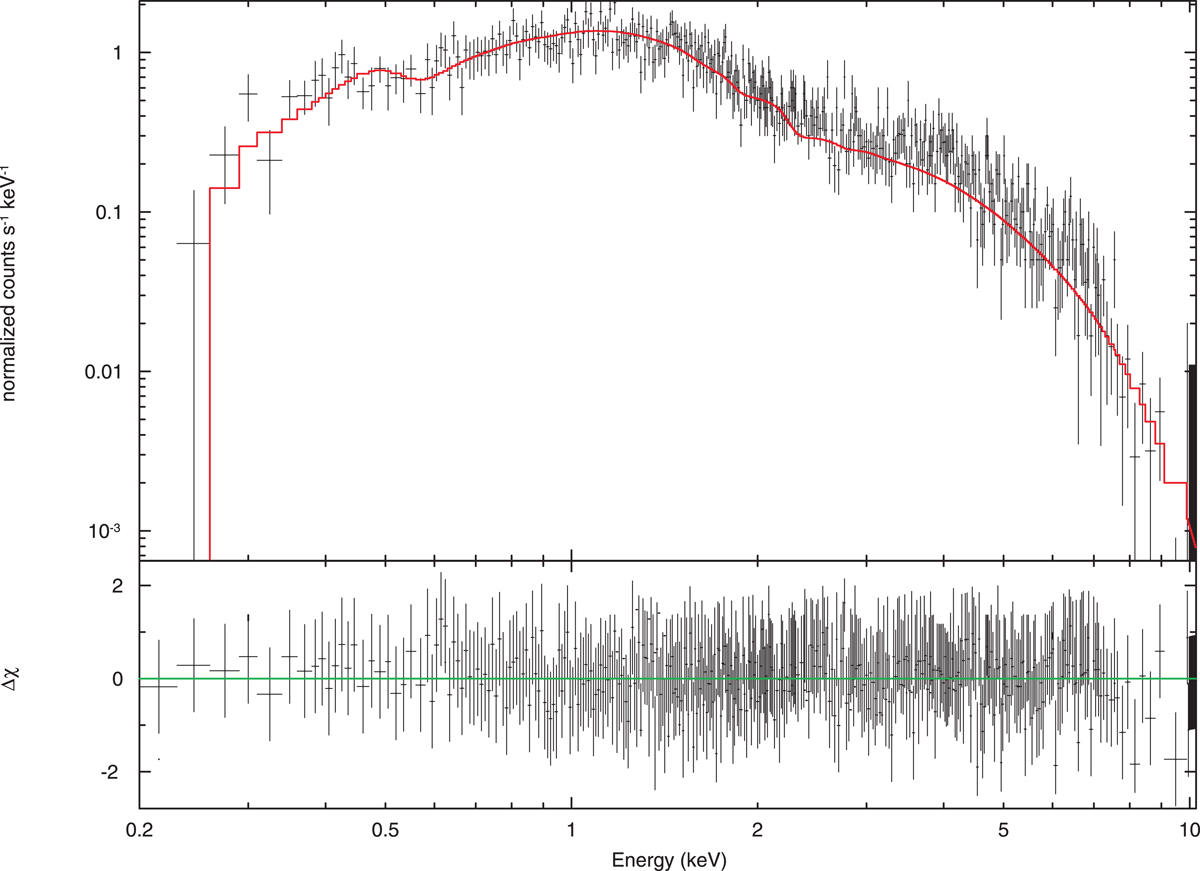
Best-fit Swift spectrum of 3C 454.3 for the IS using the tbabs*bmc model [![]() = 1.02 (770 d.o.f.)]. The best-fit parameters are Γ = 1.63 ± 0.1 and Ts = 280 ± 20 eV. The data are denoted by black crosses, while the spectral model is presented by a red histogram.
= 1.02 (770 d.o.f.)]. The best-fit parameters are Γ = 1.63 ± 0.1 and Ts = 280 ± 20 eV. The data are denoted by black crosses, while the spectral model is presented by a red histogram.
Current usage metrics show cumulative count of Article Views (full-text article views including HTML views, PDF and ePub downloads, according to the available data) and Abstracts Views on Vision4Press platform.
Data correspond to usage on the plateform after 2015. The current usage metrics is available 48-96 hours after online publication and is updated daily on week days.
Initial download of the metrics may take a while.