Fig. 6.
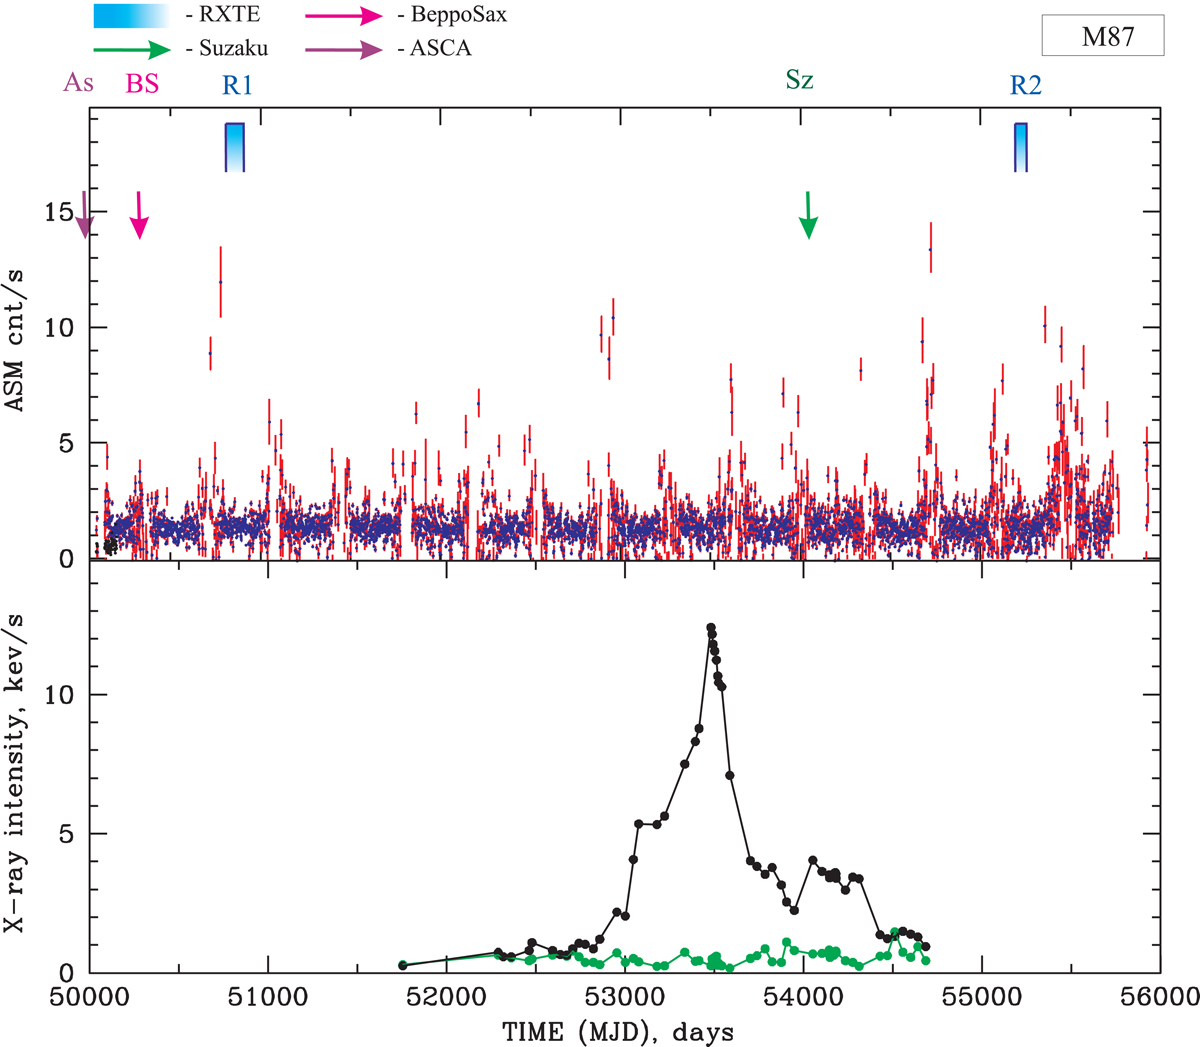
Top: evolution of ASM/RXTE count rate during 1996–2012 observations of M 87. Vertical arrows (at the top of panel) indicate temporal distribution of the RXTE (blue) and Suzaku (green) data sets listed in Tables 1–7. Bottom: evolution of Chandra X-ray intensity of the nucleus (green) and HST–1 (black) during 2000–2008 observations of M 87 according to data taken from Harris et al. (2009).
Current usage metrics show cumulative count of Article Views (full-text article views including HTML views, PDF and ePub downloads, according to the available data) and Abstracts Views on Vision4Press platform.
Data correspond to usage on the plateform after 2015. The current usage metrics is available 48-96 hours after online publication and is updated daily on week days.
Initial download of the metrics may take a while.