Fig. 20.
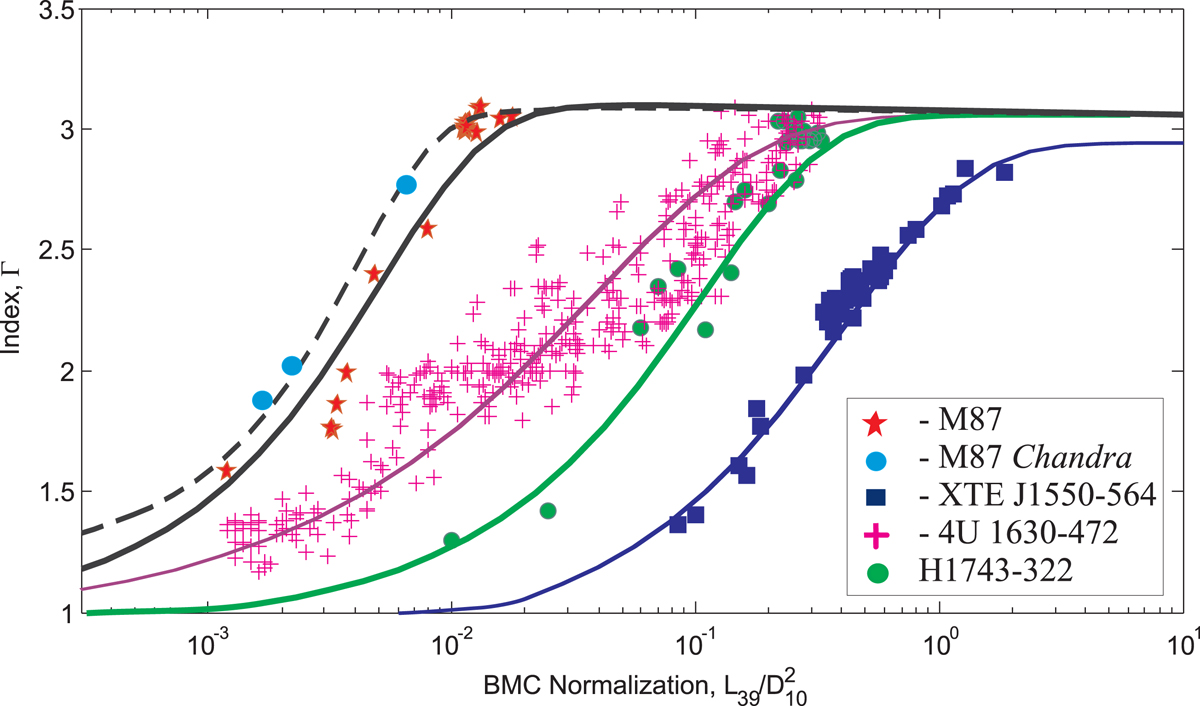
Scaling of the photon index Γ vs. the normalization NBMC for M 87 (black line – target source) using extragalactic sources: ESO 243–49 HLX–1 and M 101 ULX–1 (reference sources). Black squares stand for RXTE data of ESO 243–49 HLX–1and blue triangles indicate M 101 ULX–1 data. The black dashed line indicates the Γ-Norm correlation corrected for a nucleus emission from M 87 using Chandra data (bright blue points). For the scaling of BH mass of M 87 we used this corrected Γ-normalization track.
Current usage metrics show cumulative count of Article Views (full-text article views including HTML views, PDF and ePub downloads, according to the available data) and Abstracts Views on Vision4Press platform.
Data correspond to usage on the plateform after 2015. The current usage metrics is available 48-96 hours after online publication and is updated daily on week days.
Initial download of the metrics may take a while.