Free Access
Fig. 2.
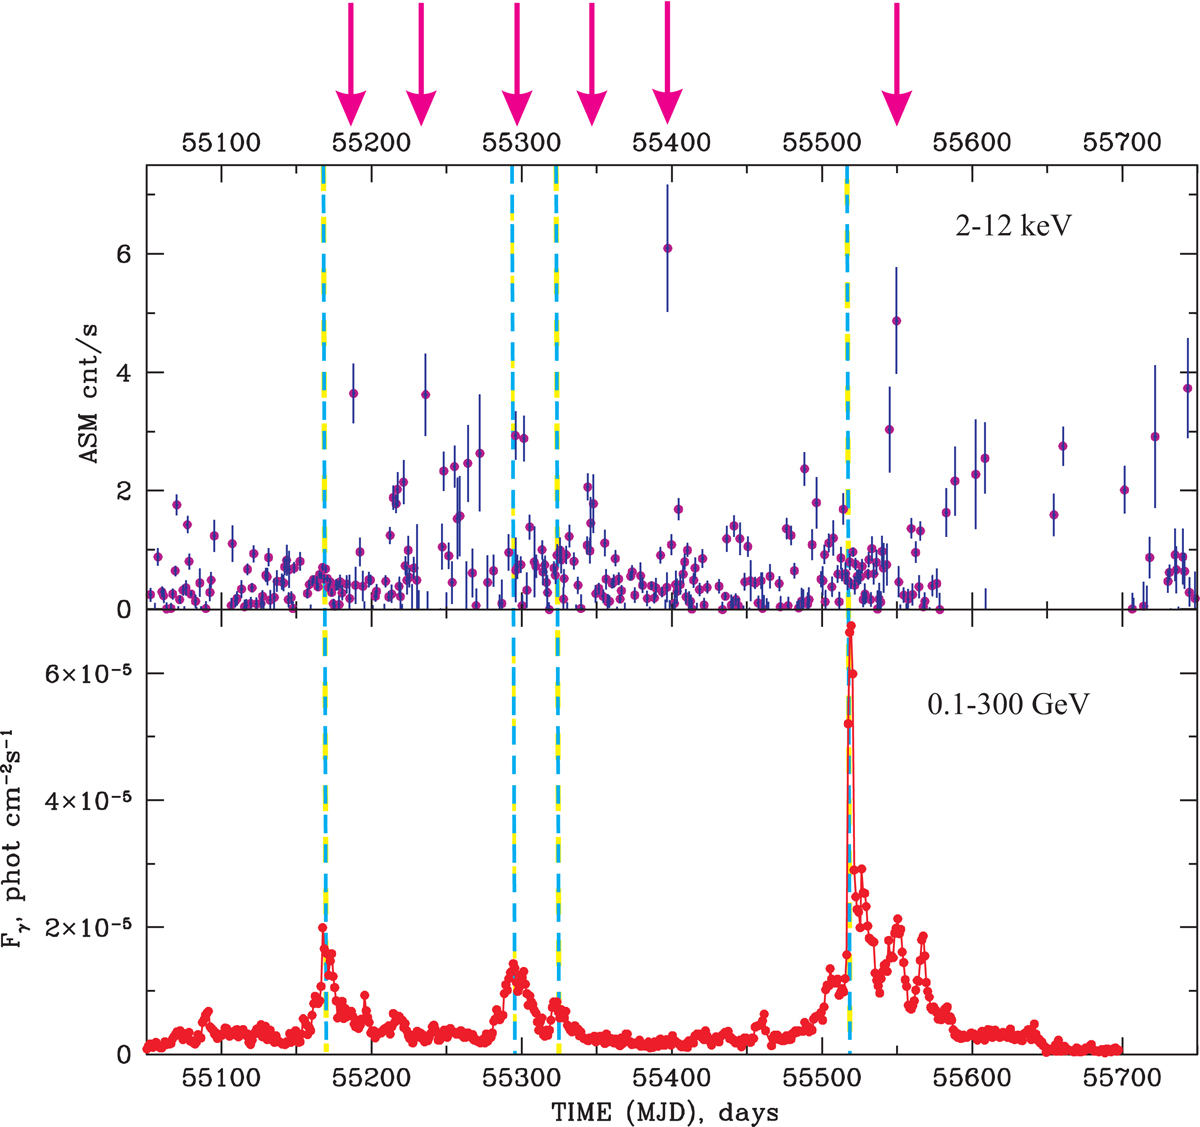
Delays of peak-fluxes for outburst of 3C 454.3 observed in 2010–2012 for two bands: 2–12 keV (top) and 0.1–300 GeV (bottom). Vertical blue dashed lines mark the peak of γ-ray flux, while pink arrows (at top of the panels) indicate the peaks of X-ray bursts.
Current usage metrics show cumulative count of Article Views (full-text article views including HTML views, PDF and ePub downloads, according to the available data) and Abstracts Views on Vision4Press platform.
Data correspond to usage on the plateform after 2015. The current usage metrics is available 48-96 hours after online publication and is updated daily on week days.
Initial download of the metrics may take a while.