Fig. 16.
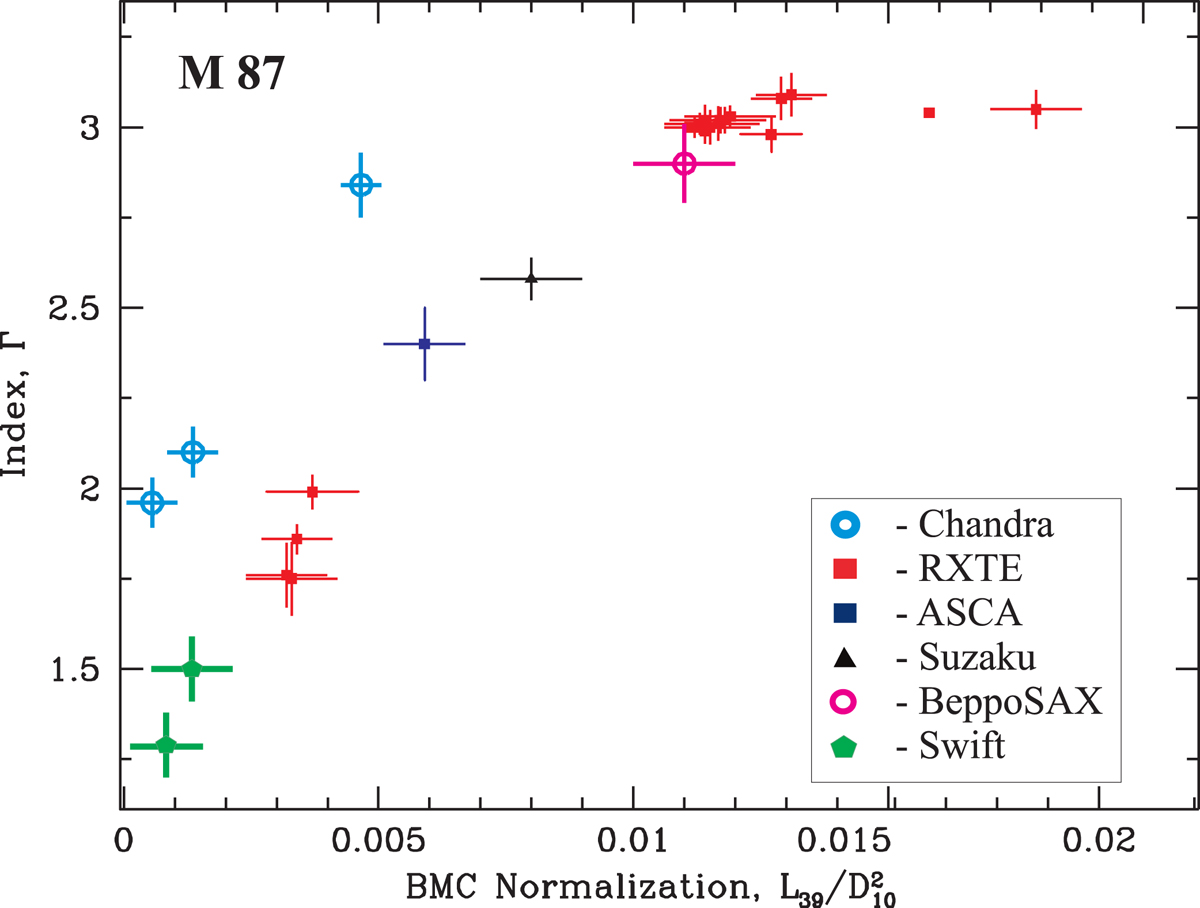
M 87: correlations of photon index Γ (=α + 1) vs. BMC normalization, NBMC (proportional to mass accretion rate) in units of ![]() . Red and blue squares show RXTE and ASCA observations, respectively, green points correspond to the Swift observations, black triangles correspond to Suzaku data, a pink circle denotes a point related to BeppoSAX observations, and blue circles show those related to Chandra observations.
. Red and blue squares show RXTE and ASCA observations, respectively, green points correspond to the Swift observations, black triangles correspond to Suzaku data, a pink circle denotes a point related to BeppoSAX observations, and blue circles show those related to Chandra observations.
Current usage metrics show cumulative count of Article Views (full-text article views including HTML views, PDF and ePub downloads, according to the available data) and Abstracts Views on Vision4Press platform.
Data correspond to usage on the plateform after 2015. The current usage metrics is available 48-96 hours after online publication and is updated daily on week days.
Initial download of the metrics may take a while.