Free Access
Fig. 11.
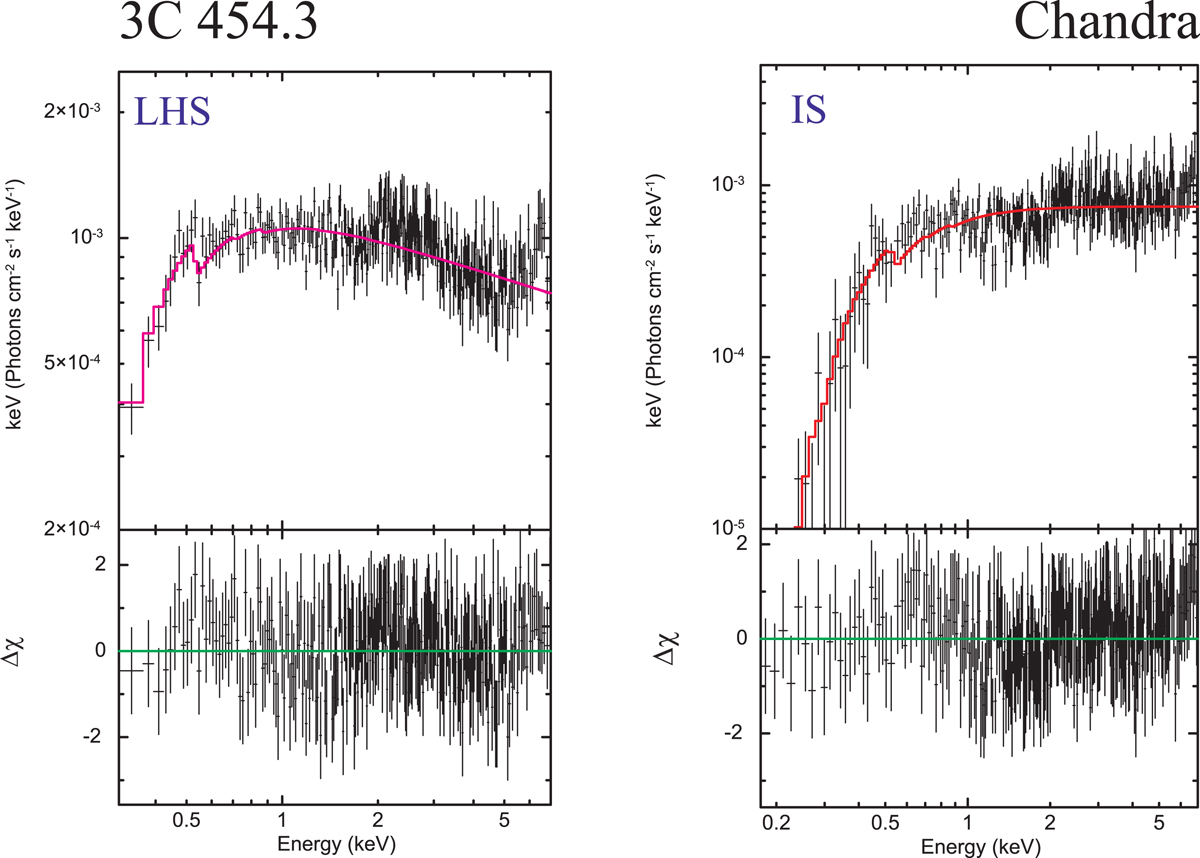
Two representative EF(E) spectral diagrams, for different states of 3C 454.3. Data are taken from Chandra observations ID = 4843 (left panel, LHS) and ID = 3127 (right panel, IS). The data are shown by black crosses and the spectral model (tbabs*BMC) is displayed as a colored line.
Current usage metrics show cumulative count of Article Views (full-text article views including HTML views, PDF and ePub downloads, according to the available data) and Abstracts Views on Vision4Press platform.
Data correspond to usage on the plateform after 2015. The current usage metrics is available 48-96 hours after online publication and is updated daily on week days.
Initial download of the metrics may take a while.