Free Access
Fig. 10.
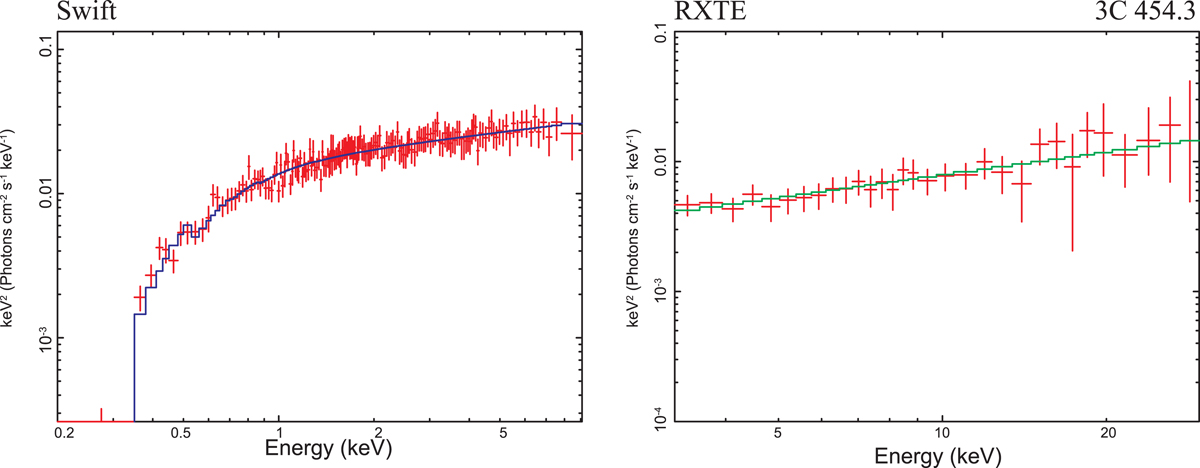
Two EFE spectral diagrams during the LHS (2009 September, 18, blue line, left panel) and the LHS (1996 November, 2 (green line, right panel)). Data taken from Swift observation 00031493003 (low/hard state) and from the RXTE observation, 20346-01-01-00 (R2 set, low/hard state).
Current usage metrics show cumulative count of Article Views (full-text article views including HTML views, PDF and ePub downloads, according to the available data) and Abstracts Views on Vision4Press platform.
Data correspond to usage on the plateform after 2015. The current usage metrics is available 48-96 hours after online publication and is updated daily on week days.
Initial download of the metrics may take a while.