Fig. 4.
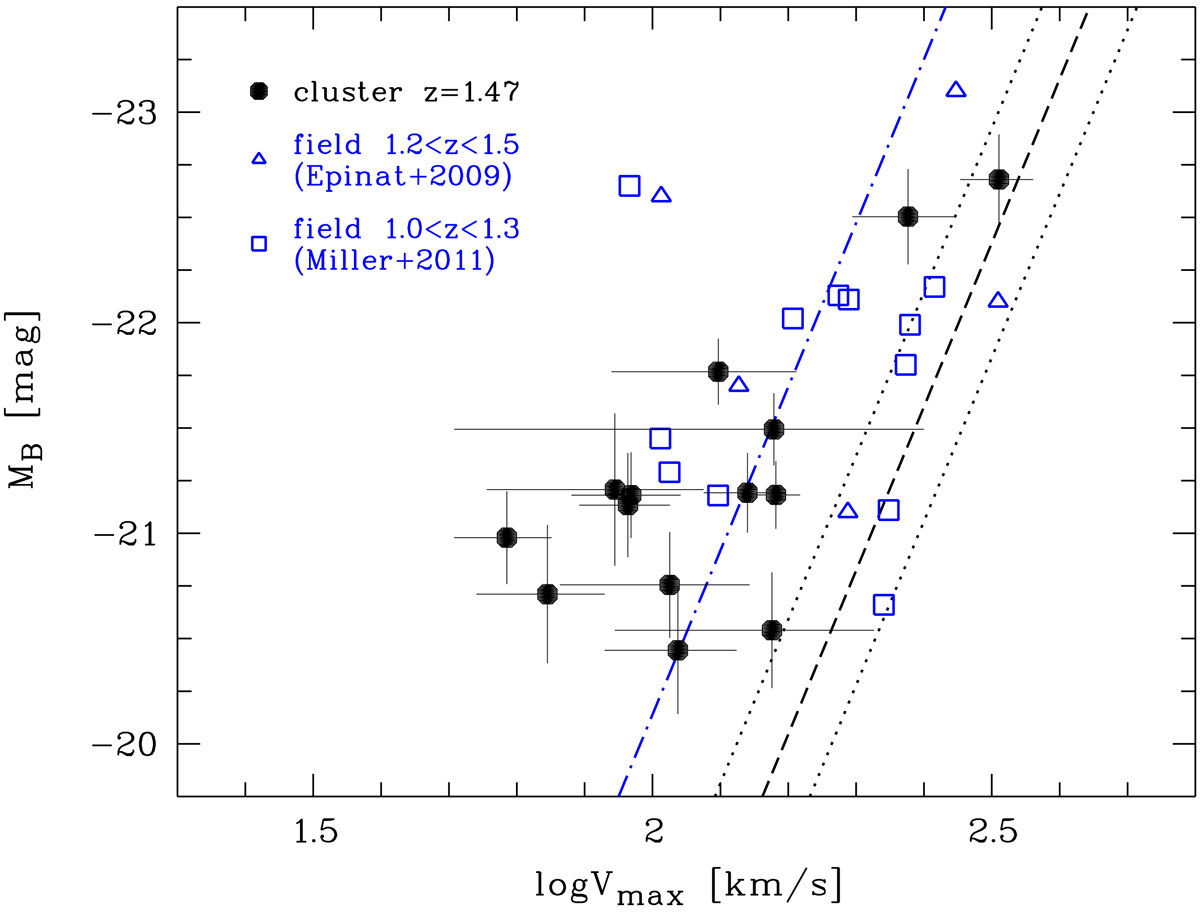
B-band Tully–Fisher diagram showing our (proto-)cluster galaxy sample at z = 1.47 (filled black circles). We also show field galaxies at 1.0 < z < 1.3 (open squares) from Miller et al. (2011) and 1.2 < z < 1.5 (open triangles) from Epinat et al. (2009) for comparison. The local Tully–Fisher relation from Tully et al. (1998) is depicted by a dashed line; the dotted lines indicate the 1σ scatter. The dash-dotted line denotes the expected TFR for field galaxies at z = 1.5, adopting the luminosity evolution found in Böhm & Ziegler (2016).
Current usage metrics show cumulative count of Article Views (full-text article views including HTML views, PDF and ePub downloads, according to the available data) and Abstracts Views on Vision4Press platform.
Data correspond to usage on the plateform after 2015. The current usage metrics is available 48-96 hours after online publication and is updated daily on week days.
Initial download of the metrics may take a while.